
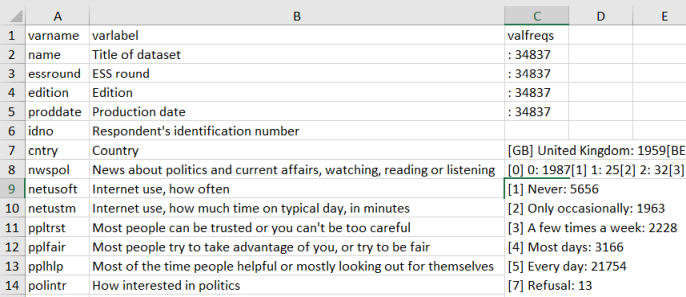
Working with categorical data, such as from surveys, requires a codebook. After spending some time unsuccessfully looking for a function that would create a nice, searchable codebook from labelled data in R, I decided to write my own. What I want to achieve is a simple table with variable names, labels, and frequencies of labelled values like the one below, to search for specific keywords in the value labels and to see distributions of various variables.
I’m using the European Social Survey Round 8 data for illustration. The full code is available here.
library(tidyverse) # for manipulating data
library(haven) # for opening SPSS files
library(labelled) # for using labels
library(tibble) # for working with tibbles
library(questionr) # for getting frequencies
library(rio) # for exporting to different formats; here: XLSX

ess_8 <- read_sav("C:/ESS8e01.sav", user_na = TRUE)
The code has two parts. The first creates a table with variable names and corresponding variable labels. The var_label command creates a list of variable labels, which I convert to a data frame with rbind. rownames_to_column does exactly what the name suggests: it moves row names to a new variable. The final step is to rename the second variable (which has an automatically generated nasty long name that I don’t want to type) to varlabel.
var_labels <- data.frame(do.call(rbind, var_label(ess_8))) %>%
  rownames_to_column(var = "varname") %>%
  rename(varlabel = !!names(.[2]))

head(var_labels)
## varname varlabel
## 1 name Title of dataset
## 2 essround ESS round
## 3 edition Edition
## 4 proddate Production date
## 5 idno Respondent's identification number
## 6 cntry CountryThe second part calculates frequencies for each variable, so that the whole distribution is in a single cell of the resulting table.
freqs <-
  # creates a list of frequencies for all variables
  lapply(ess_8, function(x) { return(questionr::freq(x)) }) %>%
  # keeps those list elements that have fewer than 1000 distinct values
  keep(function(x) nrow(x) < 1000) %>%
  # convert list to data frame
  do.call(rbind, .) %>%
  # row names become a new column `varname_value`
  rownames_to_column(var = "varname_value") %>%
  # extract `varname` as the string before the first period
  mutate(varname = gsub("(.+?)(\\..*)", "\\1", varname_value),
  # extract `value` as the string after the period, which includes the value and value label
         value = gsub("^[^.]*.","",varname_value)) %>%
  group_by(varname) %>%
  # save the position of each value within a variable as `npos`
  mutate(npos = row_number(),
  # concatenate `value` with frequency `n`
         value_n = paste(value, n, sep = ": ")) %>%
  # select three variables
  select(varname, value_n, npos) %>%
  # reshape to wide
  spread(npos, value_n) %>%
  # replace `NA` with missing strings
  mutate_at(vars(-varname), list(~ifelse(is.na(.), "", .))) %>%
  # concatenate columns with values and frequencies
  unite("valfreqs", c(2:ncol(.)), sep = "\n") %>%
  # delete empty rows
  mutate(valfreqs = sub("\\s+$", "", valfreqs))

head(freqs)
## # A tibble: 6 x 2
## # Groups: varname [6]
## varname valfreqs
## <chr> <chr>
## 1 actrolga "[1] Not at all able: 11886\n[2] A little able: 10968\n[3] Quit~
## 2 admub "[1] Group 1: 8858\n[2] Group 2: 8489\n[3] Group 3: 8738\n[4] G~
## 3 aesfdrk "[1] Very safe: 11434\n[2] Safe: 17118\n[3] Unsafe: 4946\n[4] V~
## 4 agea "[15] 15: 203\n[16] 16: 344\n[17] 17: 413\n[18] 18: 409\n[19] 1~
## 5 anctry1 "[10000] European: 91\n[11000] West European: 7\n[11010] Austri~
## 6 anctry2 "[10000] European: 152\n[11000] West European: 20\n[11010] Aust~The freqs table is sorted alphabetically by varname, but merging it to var_labels will restore the original variable order in the dataset.
full_join(var_labels, freqs, by = "varname")Here is the whole procedure written as a function, with data as the input.
create_codebook <- function(data) {

  var_labels <- data.frame(cbind(names(var_label(data)),
                                 do.call(rbind, var_label(data)))) %>%
    rename(varname = X1, varlabel = X2)

  freqs <- lapply(data, function(x) { return(questionr::freq(x)) }) %>%
    keep(function(x) nrow(x) < 1000) %>%
    do.call(rbind, .) %>%
    tibble::rownames_to_column(var = "varname_value") %>%
    mutate(varname = gsub("(.+?)(\\..*)", "\\1", varname_value),
           value = gsub("^[^.]*.","",varname_value)) %>%
    group_by(varname) %>%
    mutate(npos = row_number(),
           value_n = paste(value, n, sep = ": ")) %>%
    select(varname, value_n, npos) %>%
    spread(npos, value_n) %>%
    mutate_at(vars(-varname), funs(ifelse(is.na(.), "", .))) %>%
    unite("valfreqs", c(2:ncol(.)), sep = "\n") %>%
    mutate(valfreqs = sub("\\s+$", "", valfreqs))

  full_join(var_labels, freqs, by = "varname")
}
Applying the create_codebook function to the ess_8 table and exporting to excel creates the codebook just as I wanted.
create_codebook(ess_8) %>%
  export("ESS_8_codebook.xlsx")