Voting for a party that ends up losing the election is known to be associated with lower satisfaction with democracy and trust in the parliament (cf. Martini and Quaranta 2019). How does Poland compare to other European countries? How has the winner-loser trust gap changed in Poland over time, and how have trust levels among supporters of current and former ruling parties changed in periods when they were not in government? I use data from the European Social Survey, round 8 combined with the ParlGov dataset on electoral results and cabinet composition to answer these questions.
The code used in this post is available here.
Winner-loser trust gap across countries
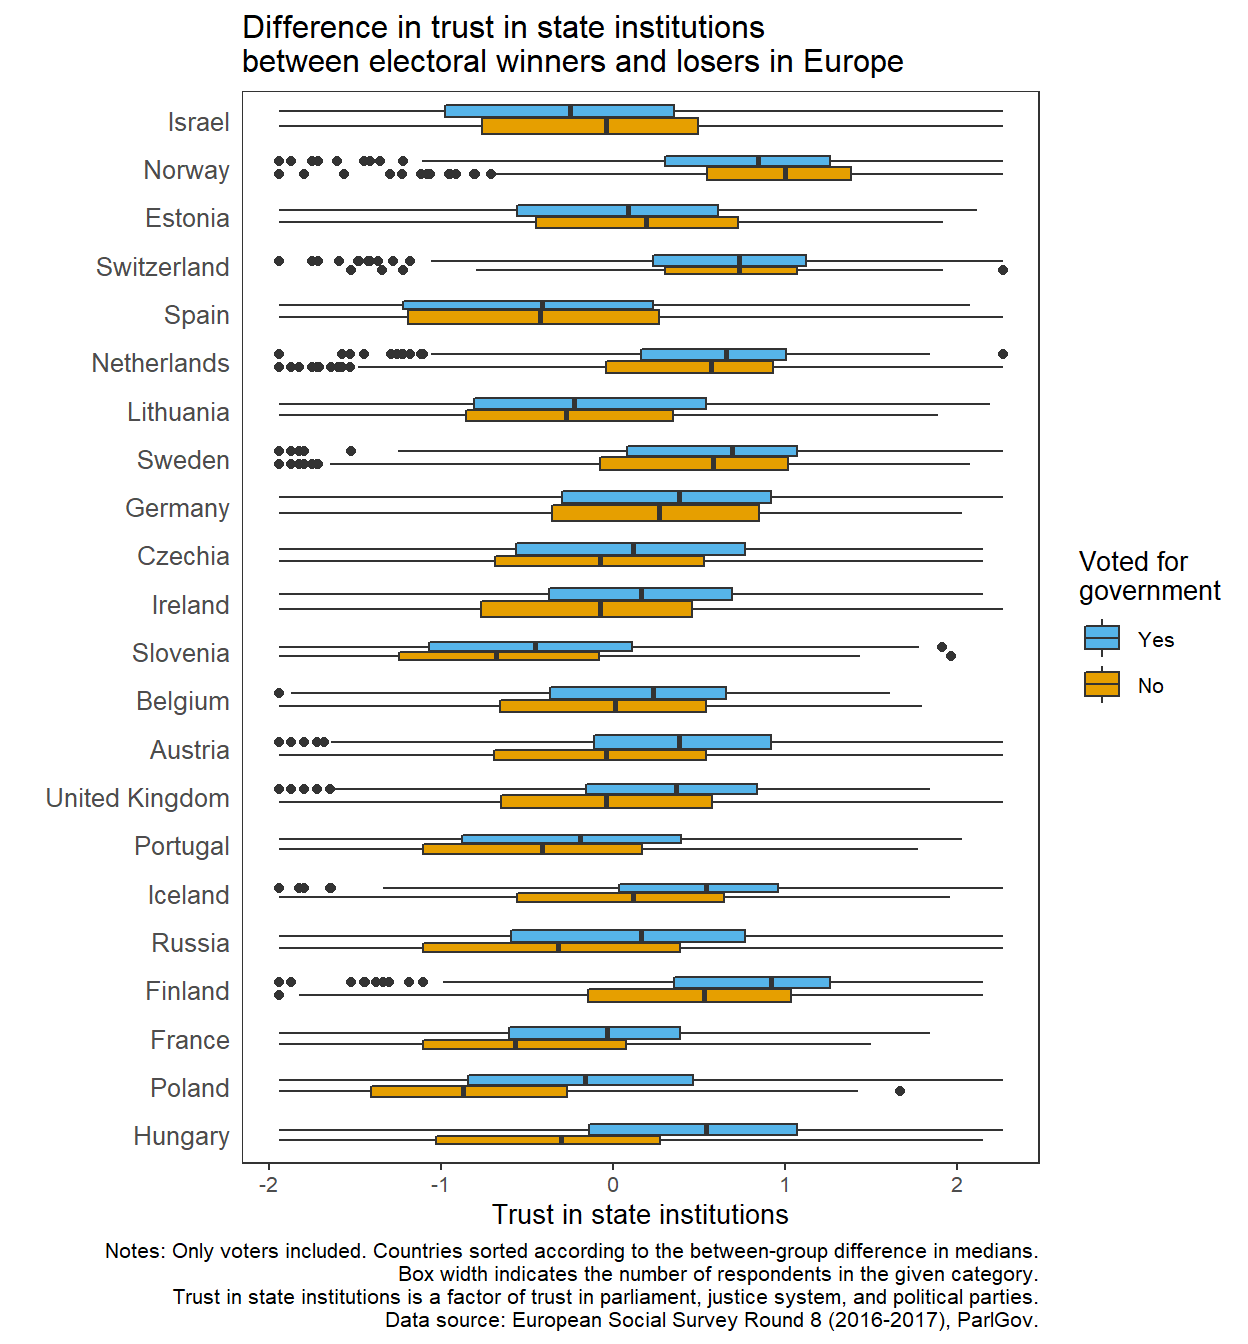
First, I graph winner-loser gaps in trust in state institutions in 2016/2017, using the most recent ESS Round 8. Trust in state institutions is a factor of trust in the parliament, the legal system, and the polital parties, and only individuals who have voted in the most recent election before ESS Round 8 fieldwork were included. In the graph below, countries are sorted according to the decreasing gap between the median trust in institutions among respondents who declared having voted for one of the party in the government at the time of the survey and those who declared having voted for one of the opposition parties. The width of the box indicates the number of respondents in the given category. I decided to exclude Italy because of its unstable government situation.
It turns out that while in most countries electoral winners have higher trust in institutions than electoral losers, in three countries the association is the opposite: Israel, Norway, and Estonia. This might be related to governments having lost popular support or being minority governments. In Spain and Switzerland the medians of the two groups are almost the same. The highest polarization is in Hungary, Poland, and France.

Winner-loser trust gap in Poland
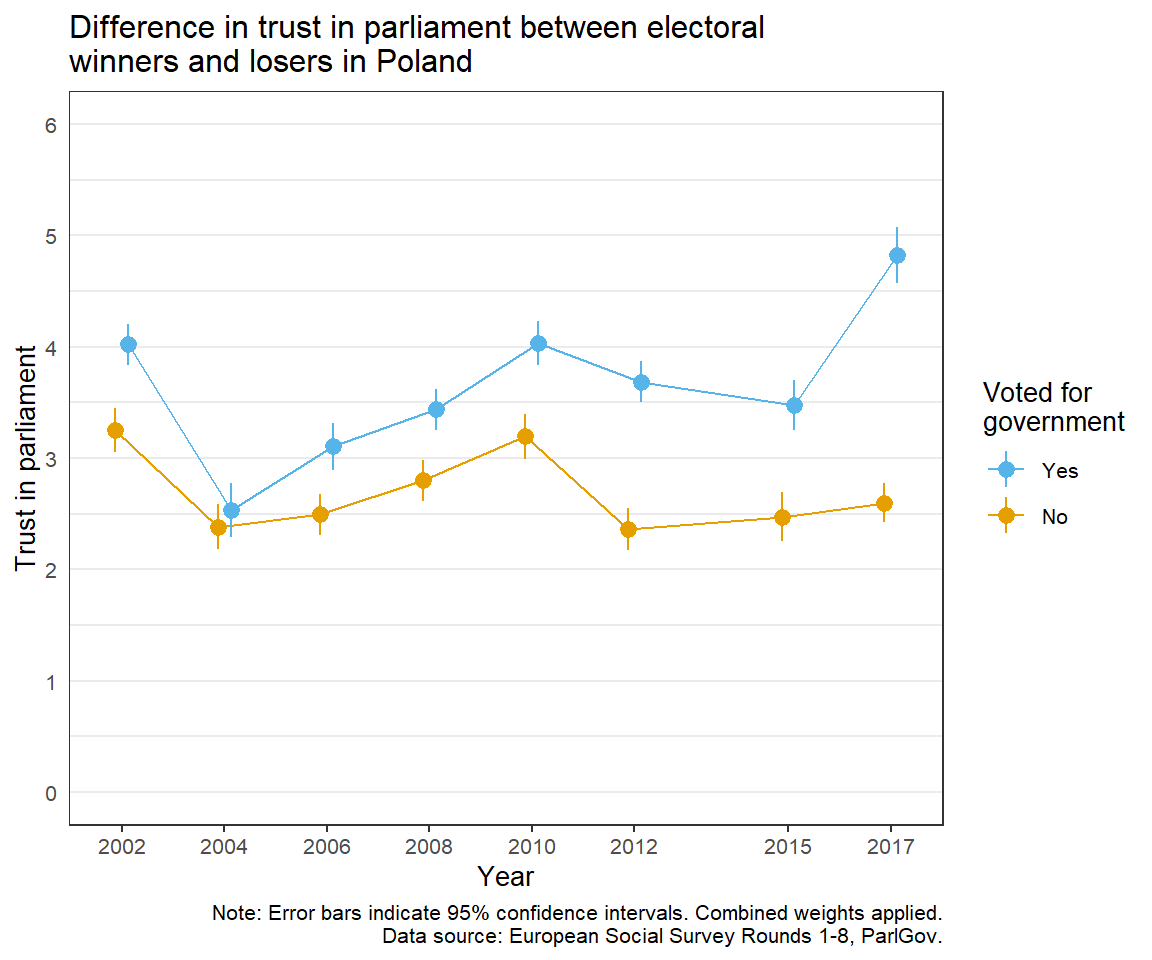
Next, I take a closer look at the winner-loser gap in Poland, using all eight rounds of the ESS. The first round did not include the item on trust in political parties, so in the graphs below I only use trust in parliament, which in the ESS is measured on a 0-10 scale. X axis ticks indicate the year when ESS fieldwork (or most of it) took place.
The time series starts in 2002 with a relatively small trust gap of less than a point on a 0-10 scale. The gap then drops to almost zero in 2004, due to the decline in trust among supporters of the ruling parties, Socialdemocratic Alliance (SLD) and the Polish Peasant’s Party (PSL), which formed a coalition from 2001 to 2005. The gap increased again in 2006 under a new government coalition led by Law and Justice (PiS). In 2007 PiS lost the pre-term election and a coalition of the Civic Platform (PO) and the Polish Peasant’s Party took over. The trust gap remained roughly stable - with overall increases in trust levels - until 2010, increased sharply in 2012, largely due to the drop in trust of the losers, and shrank again in 2015 (the survey was carried out before the 2015 parliamentary election). In late 2015 PiS won the election and formed a single-party government. The trust gap in 2017 was the largest ever, owing to a sharp increase in trust among supporters of PiS.

Trust differences across parties in Poland
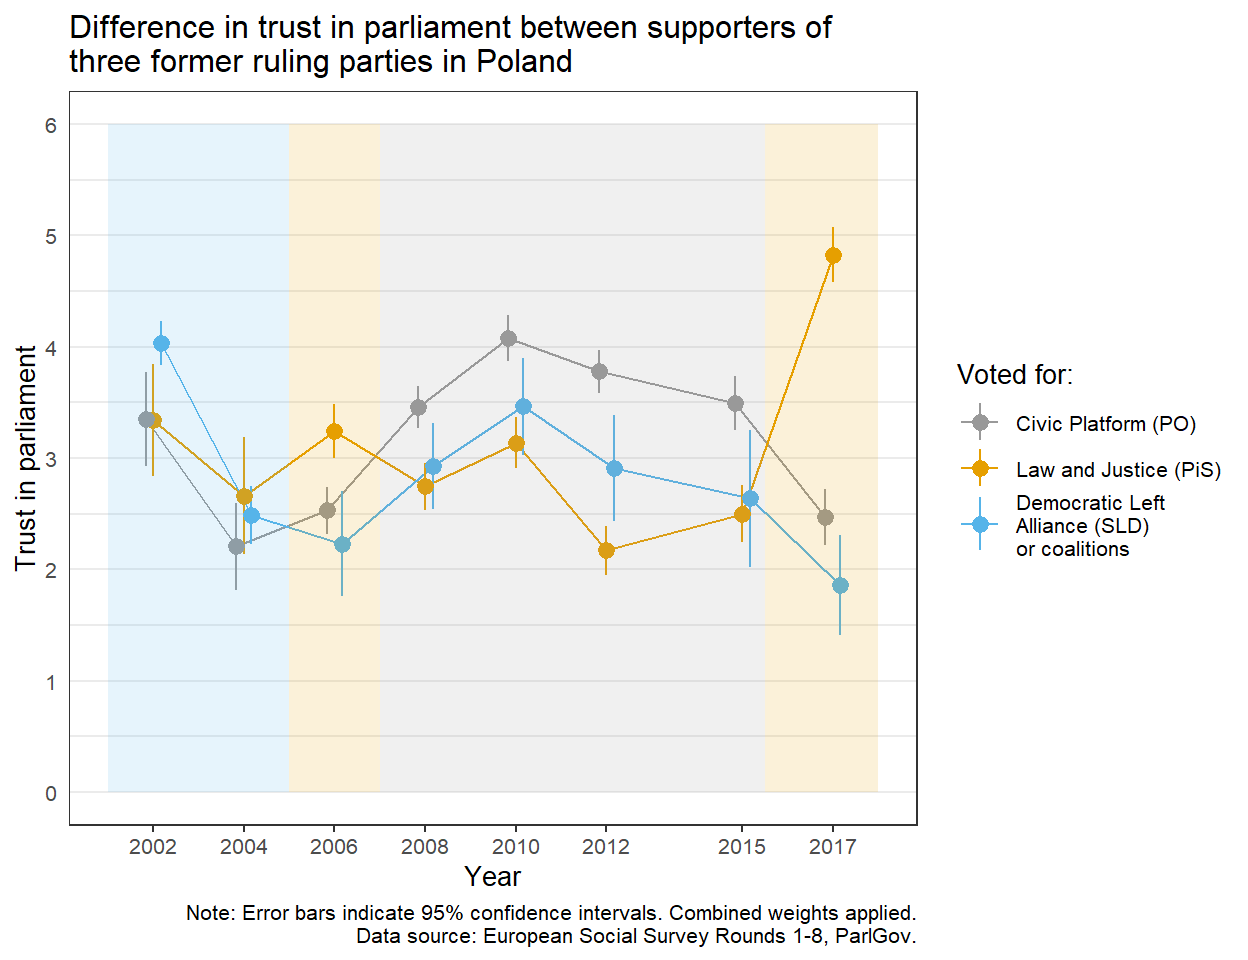
What were the trust levels among supporters of three former (including one current) ruling parties, and how they changed when the parties lost power? The graph below shows mean levels of trust in parliament among supporters of SLD, PO, and PiS, between 2002 and 2017. The shading of the graph indicates which party was currently leading the government: blue for SLD, orange for PiS and grey for PO.
At all points, with one exception, supporters of the ruling party have clearly higher levels of trust than supporters of the two opposition parties. The exception is in 2004, when trust levels are universally low. While average trust among SLD and PO supporters has stayed in the range roughly between 2 and 4 points (on a 0-10 scale), after the most recent election in 2015 mean trust among those who had voted for PiS increased to almost 5 points - likely a signal of particularistic rather than generalized attitudes.
The next election is in the fall of 2019. Given the current political polarization and the upcoming parliamentary election in the fall of 2019, it is hard to make any predictions, especially for the future. Looking at the trust trends in the last years it seems likely that (1) if PiS loses, trust among their supporters will drop below current levels of the opposition and trust among winners (a coalition around PO?) will increase below current PiS levels, so the gap will stay roughly the same albeit at an overall lower level, while (2) if PiS wins, trust among supporters of the opposition might fall further, but trust among PiS supporters will unlikely increase.

