
with Saleha Habibullah, Sakinat Folorunso, and Vera Paul
BigSurv18 and the Green City Hackathon
One of accompanying events of the BigSurv18: Big Data Meets Survey Science conference in Barcelona last week was the Green City Hackathon. The challenge was as follows: The city of Barcelona wants to reduce car traffic, in particular by promoting use of bicycles. The city is collecting quite a lot of data on bike use, especially about the public city bike share system “Bicing”, and needs the data analyzed, including descriptives, predictions, analytic tools, etc. The goal of the Green City Hackathon was to design or at least propose such analyses and/or tools, dealing with bike usage, safety, complaints, or other related issues. The data challenge primarily used data coming from the Open Data BCN portal, a key unit in the Barcelona Digital City Plan, but other data sources were also permitted.
The full code used to generate this post can be found here.
Team number 5
The hackathon situation is unlike much of academic research experience: working with people met for the first time, who have different backgrounds and skills, need to get up to speed fast, extremely limited time, little knowledge of the subject matter, need for presentable results, acceptance of “no results” as results, i.e. plans for future actions (analyses, data collection, etc.) instead of findings and conclusions.
After a quick brainstorm we (Saleha, Sakinat, Vera, and Marta) decided to focus on the most basic barriers to using the Bicing system: lack of available bikes in Bicing stations and altitude (Barcelona is a hilly city!). To our surprise we found that these two issues are related.
Data
We used data from the Open Data BCN portal, specifically two datasets:
- Bicing bike use in September with data on the number of bikes in use recorded every 15 minutes,
- Bicing stations status in September with data on the number of bikes and free slots in each of the 463 Bicing stations, again recorded in 15-minute intervals.
Bike use
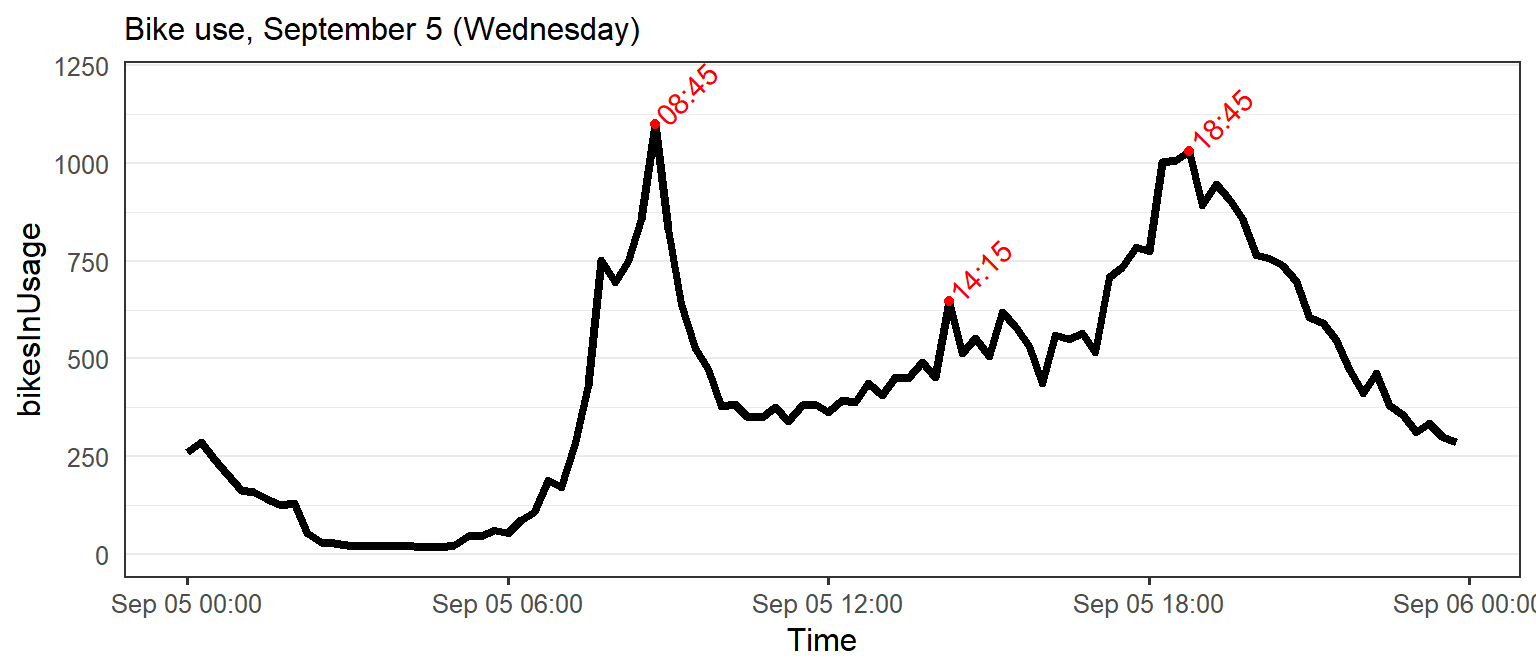
First, we wanted to find out a little about how the bikes are used. We plot bike use (the number of Bicing bikes in use) over time for a random weekday in September. The graph below clearly shows the peaks and valleys of bike use during the day: the morning peak is about 8.45 AM followed by an evening peak just before 7 PM. Other weekdays exhibited similar patterns. This suggests that Bicing bikes are used for commutes to work or school.
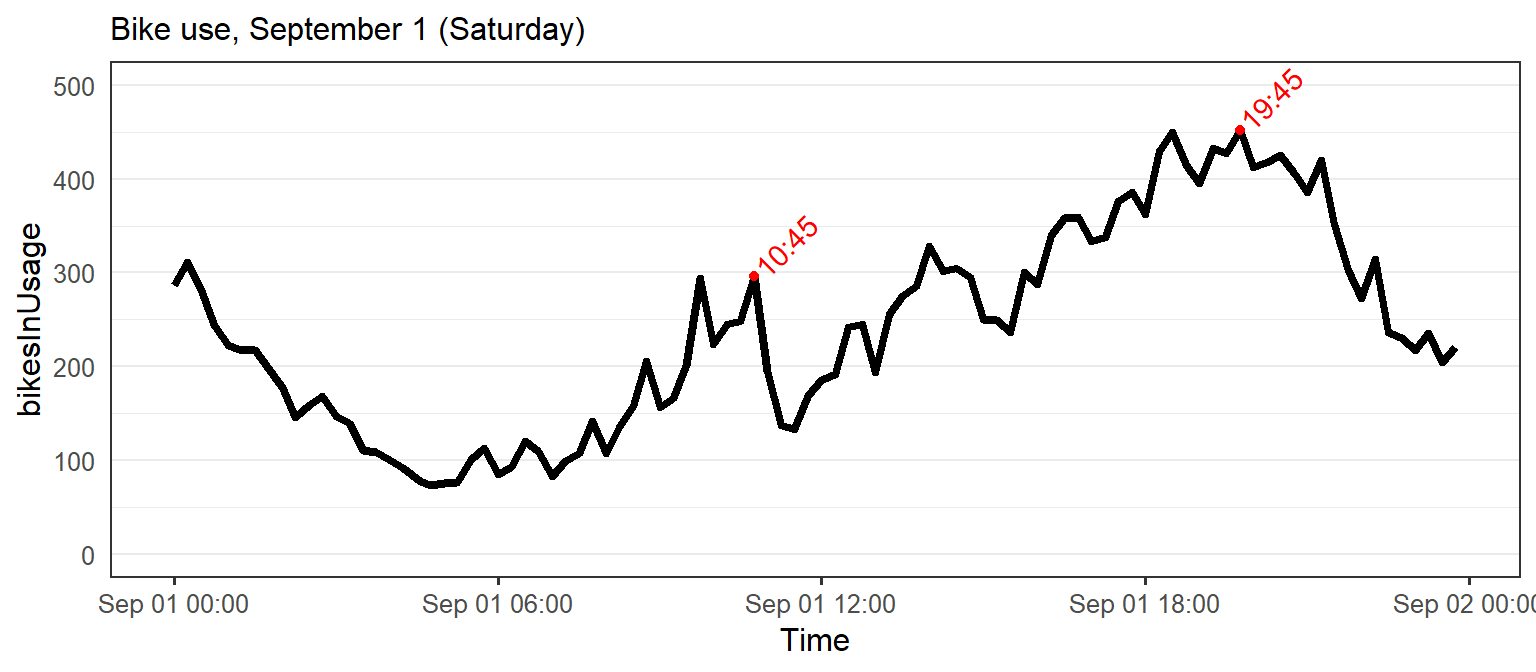
The pattern of morning and evening peaks can also be observed on weekends, but the peaks are much lower, and later in the day.
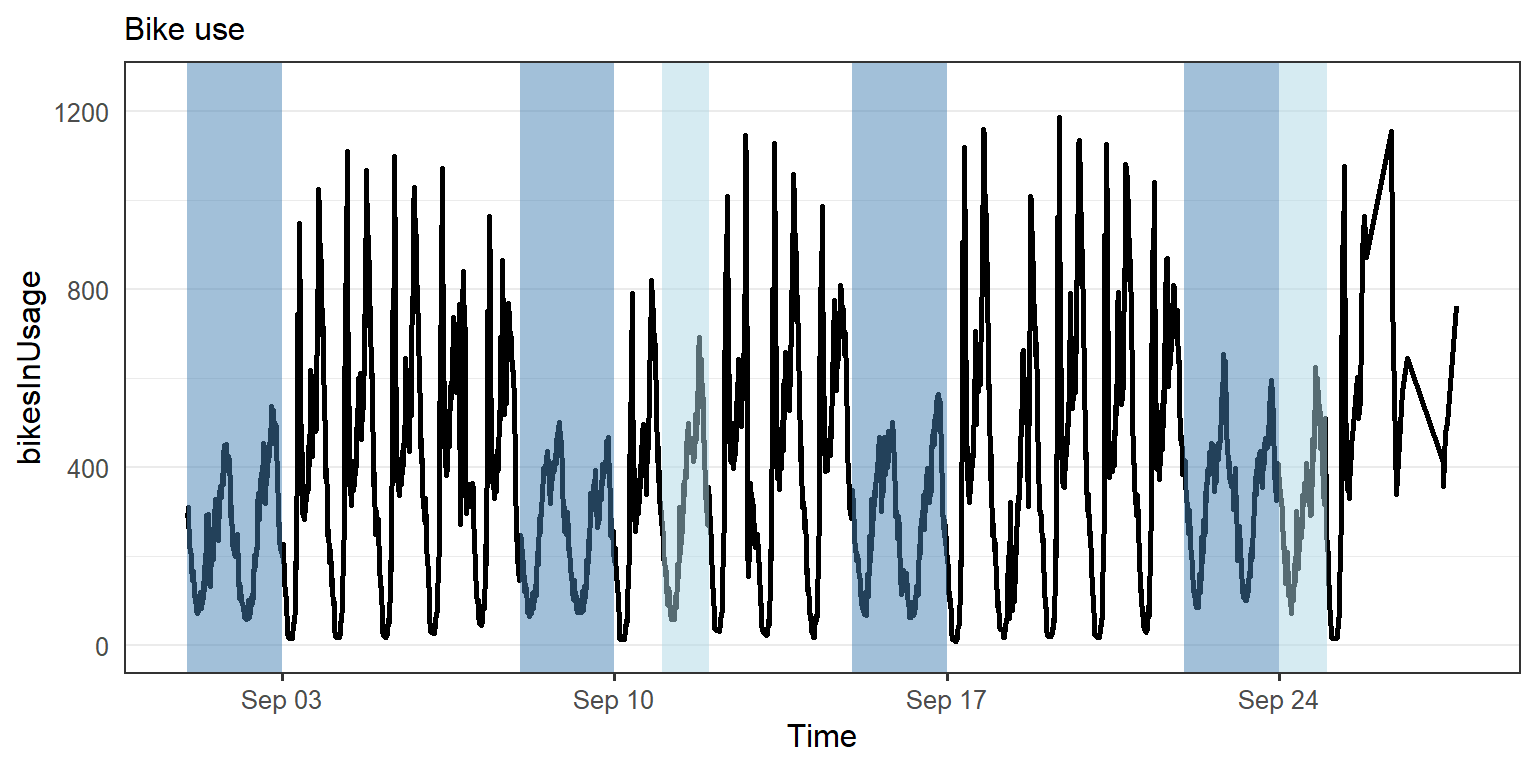
Looking at the whole month, one can distinguish weekdays from weekends (darker blue). Weekday anomalies (lighter blue, September 11 and 24) turned out to be holidays (according to this website). For some reason the data end on September 27, and so does the plot.
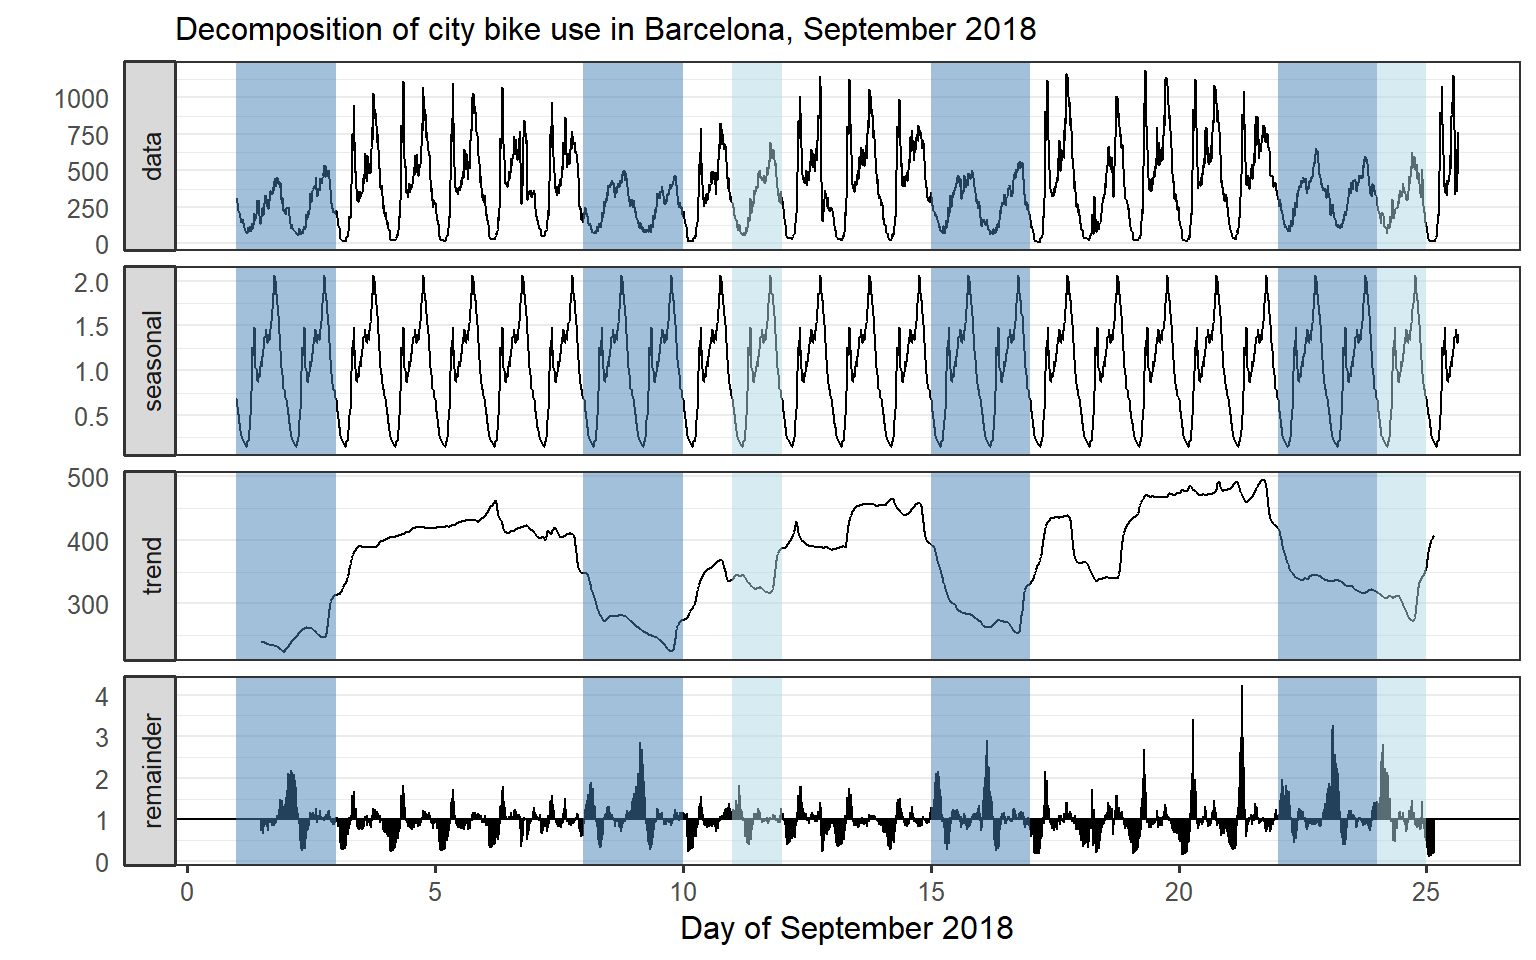
Decomposing the time series reveals daily seasonality as well as weekly cycles, the latter interrupted by the mid-week holidays.
Altitude of Bicing stations
Next, we investigated the location of Bicing stations and their altitude. The map below shows the location of the Bicing stations with colors indicating the altitude of the station. Most of the station are green, which means they are located between 0 and 50 meters above sea level. The yellow and orange stations are around 70-80 meters a.s.l., and the red stations are most elevated - 100 meters and up to 138 m a.s.l.
Location of mechanical and electric bike stations
We also wanted to see if altitude has anything to do with the type of station, i.e. whether it’s for mechanical or electric bikes. The map below suggests that electric bike stations, which account for about 10% of all Bicing stations) are relatively evenly distributed across the city.
An analysis of the data shows however that more electric bike stations are located at higher altitudes. While among stations located below 50 m above sea level electric bike stations account for about 9% and 10% for stations between 50 and 10 meters, among stations above 100 m a.s.l. the share increases to 17%.
## # A tibble: 3 x 2
##   alt3               mean_electric
##   <chr>                      <dbl>
## 1 1. Less than 50 m         0.0920
## 2 2. 50-99 m                0.105
## 3 3. 100 m and above        0.167
Empty stations by station altitude
The map of stations with color coded proportion of time when no bikes are available shows that stations that are more elevated tend to be without bikes more often than those located lower.
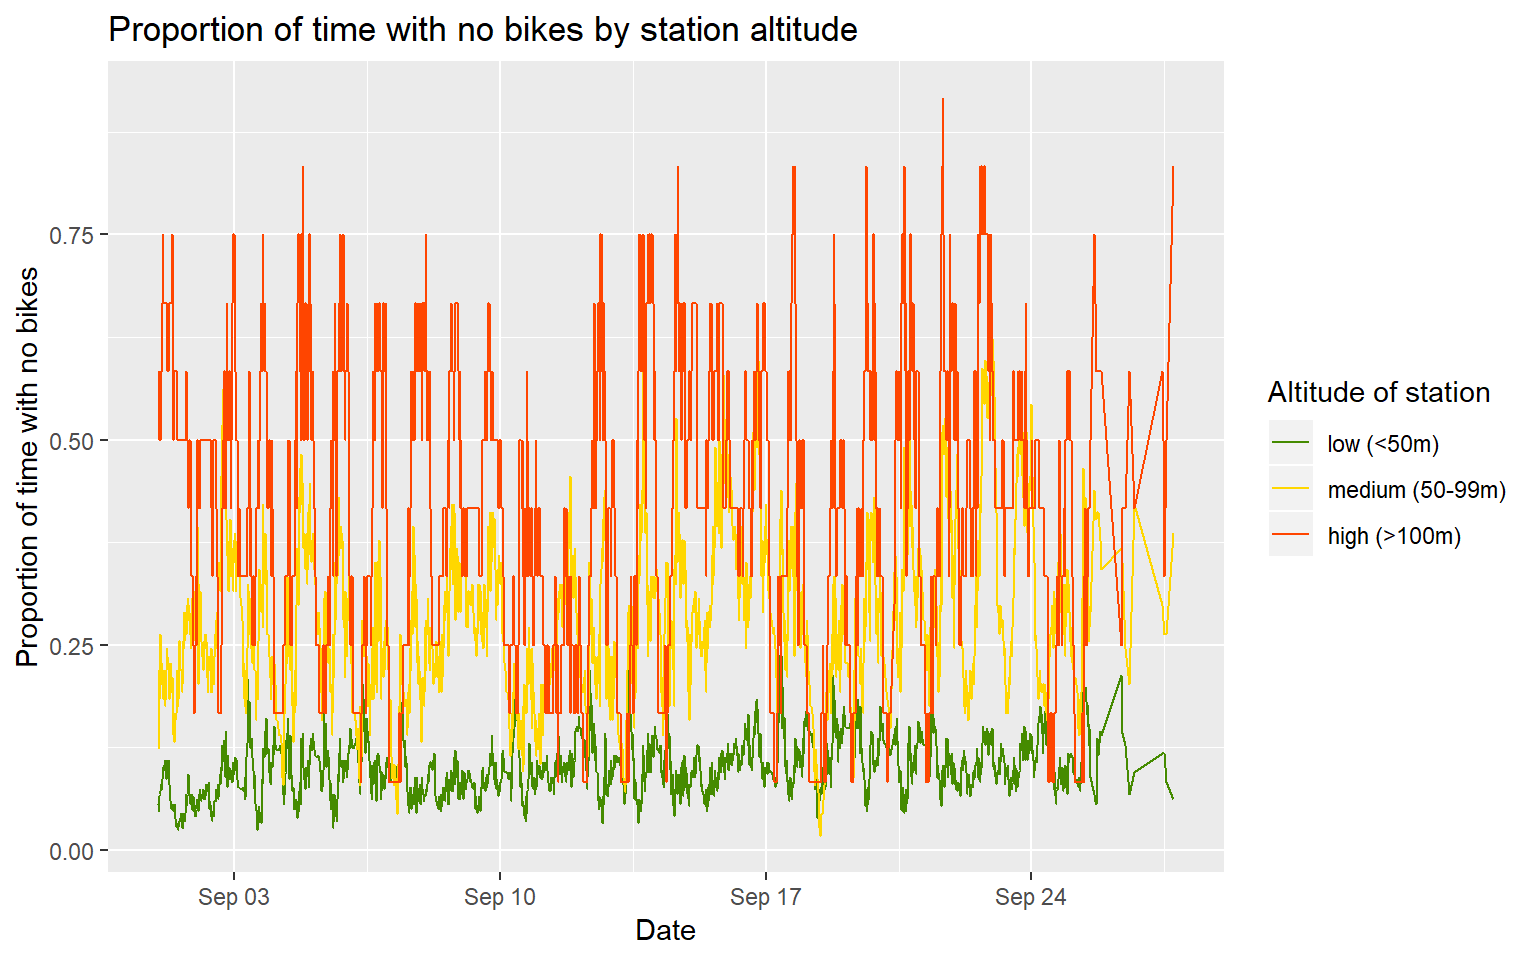
To see how systematic these differences are, we divided the stations into three groups by altitude: below 50 m a.s.l., 50-99 m, and 100 meters or higher, and plotted the proportion of time the stations were empty each day for all days in September. As the below graph shows, stations located highest (in red) are empty most often, while stations located al lowest altitudes (in green) are seldom empty. One possible reason is that bike use and bike replenishment are out of sync and leave some of the stations without bikes most of the time.
Next steps
This is what we were able to accomplish in the approximately 4.5 hours of group work on the challenge. The available data allow much more elaborated analyses of bike use at different times and locations. The station and bike use data could be matched with weather data, survey data, residential data, etc. for further insights. Ideally, there would be a dataset with all rental and return parameters for each bike to see what commute routes are most popular and at what times, and whether, for example, people bike downhill in the mornings and try to use electric bikes in the evenings to go back uphill to their homes.