
I recently came across Jennifer Oser’s 2017 article in Social Indicators Research about “political tool kits”, i.e. profiles (or patterns) of participation in different political activities. Her general argument is that research on citizen participation would benefit from analyses of such participation patterns instead of (or at least in addition to) just looking at determinants of participation in single activities. She employs latent class analysis to data from the U.S. Citizen, Involvement and Democracy Survey and finds that four categories of participants can be distinguished (p. 245):
1. “the disengaged” (60% of the population) who only participate in elections and nothing else,
2. “mainstream participants” (24%), who engage in the more popular forms of participation,
3. “high-voting engaged” (10%) participate in direct activities, but not in electoral-oriented activities, and
4. “all-around activists” (6%) who are generally very active.
Overall, class size increases with declining activity, and there are some predictable socio-demographic differences between classes.
I check whether the same 4-group model applies to Poland, using this as an opportunity to learn latent class analysis. Crucial to this kind of analysis is a dataset with recorded participation in many types of activities. Oser uses the U.S. Citizen, Involvement and Democracy Survey, which asks about participation in the last 12 months in 15 distinct activities1. The best dataset from this point of view I know of is the European Social Survey (ESS), which asks about 9 forms of participation, also in the last 12 months (with the exception of voting in the last elections whenever they were)2. The U.S. CID survey and ESS Round 3 were designed to be comparable and share a set of identical questions, but in this example I use the most recent round of ESS, Round 8. The full code used for graphs and tables in this post can be found here.
Political participation in Poland
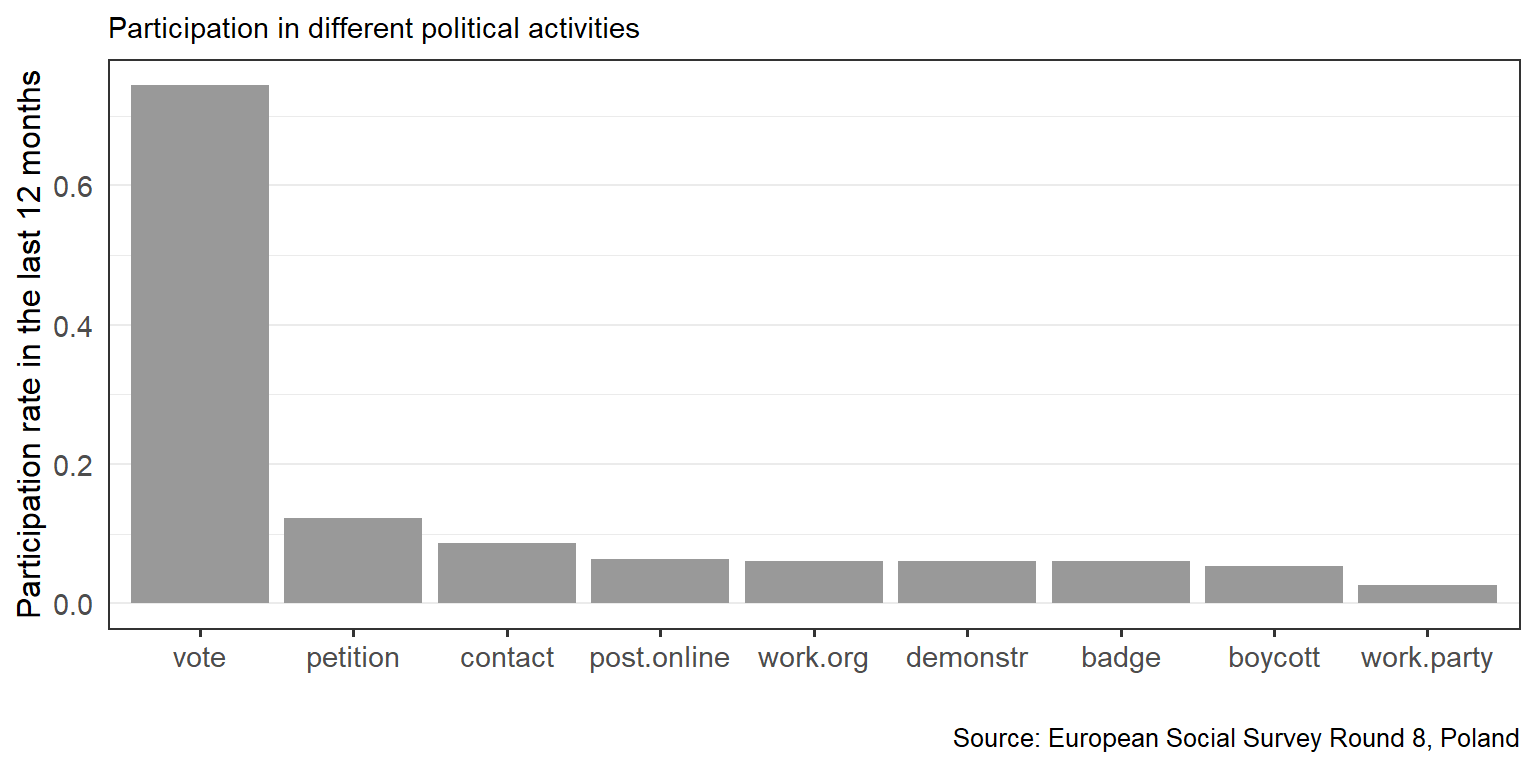
I start by calculating the prevelance of each political activity. As can be read from the graph below, with the exception of voting in elections (declared by 74% of respondents), political participation in Poland in very low. For any activity apart from signing petitions and voting, participation rates are below 10% down to around 2% for working for political parties. This already suggests that increasing the number of classes will very quickly lead to tiny sizes of classes.
Latent class analysis
Latent class analysis is a technique of identifying patterns across a set of nominal or ordinal variables, including binary indicators of participation in various activities. In this particular example latent class analysis will distinguish between individuals who engage in different subsets of the political activities the ESS asks about.
To estimate latent class models I use the poLCA package and relied on this post and this presentation for guidance.
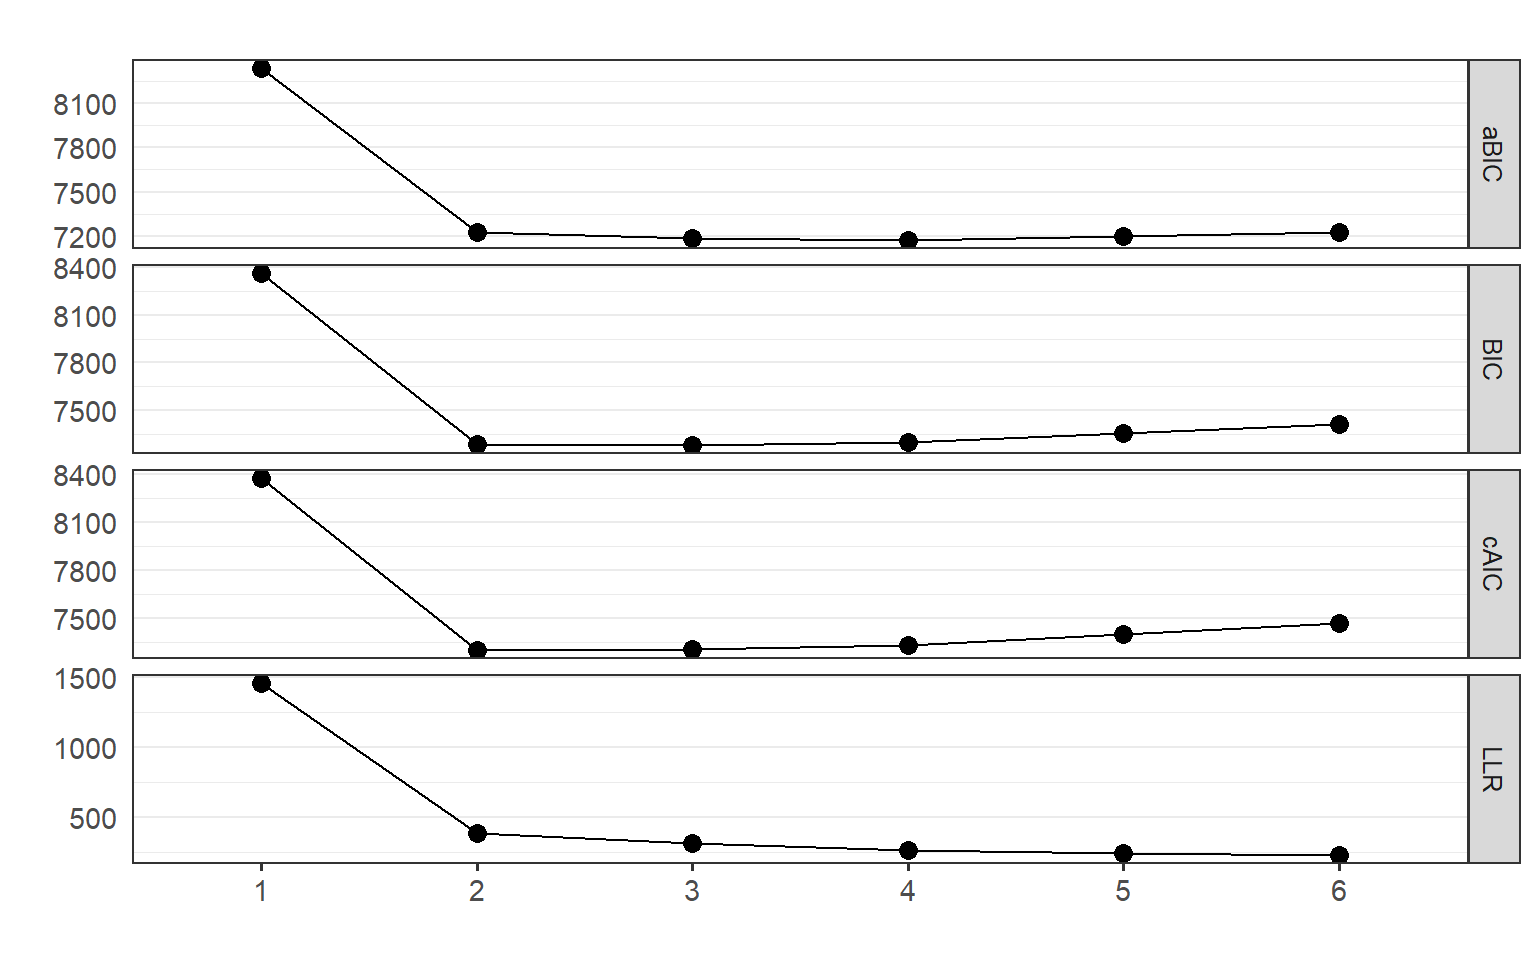
The crucial step with latent class analysis is the choice of the model with the most appropriate number of classes. There should be enough classes to capture all the important patterns in the data, and at the same time few enough classes to allow for meaningful interpretation and labeling of the distinct patterns. In practice, models are typically chosen based on fit statistics, in particular on the Bayesian Information Criterion (BIC), whose lower values indicate better model fit.
I estimate models for 1-6 classes, and calculate fit statistics for each of them. They are presented in the table and graph below. BIC points to the three-class model as providing optimal fit, and this is the model I will explore further.
| N classes | BIC | aBIC | cAIC | Log-likelihood ratio |
|---|---|---|---|---|
| 1 | 8365.512 | 8336.920 | 8374.512 | 1455.5134 |
| 2 | 7285.204 | 7224.843 | 7304.204 | 386.2608 |
| 3 | 7280.078 | 7187.949 | 7309.078 | 318.0393 |
| 4 | 7296.792 | 7172.894 | 7335.792 | 264.1632 |
| 5 | 7352.418 | 7196.751 | 7401.418 | 249.7268 |
| 6 | 7411.774 | 7224.338 | 7470.774 | 234.5133 |
Three types of participants: the Disengaged, Activists, and Protesters
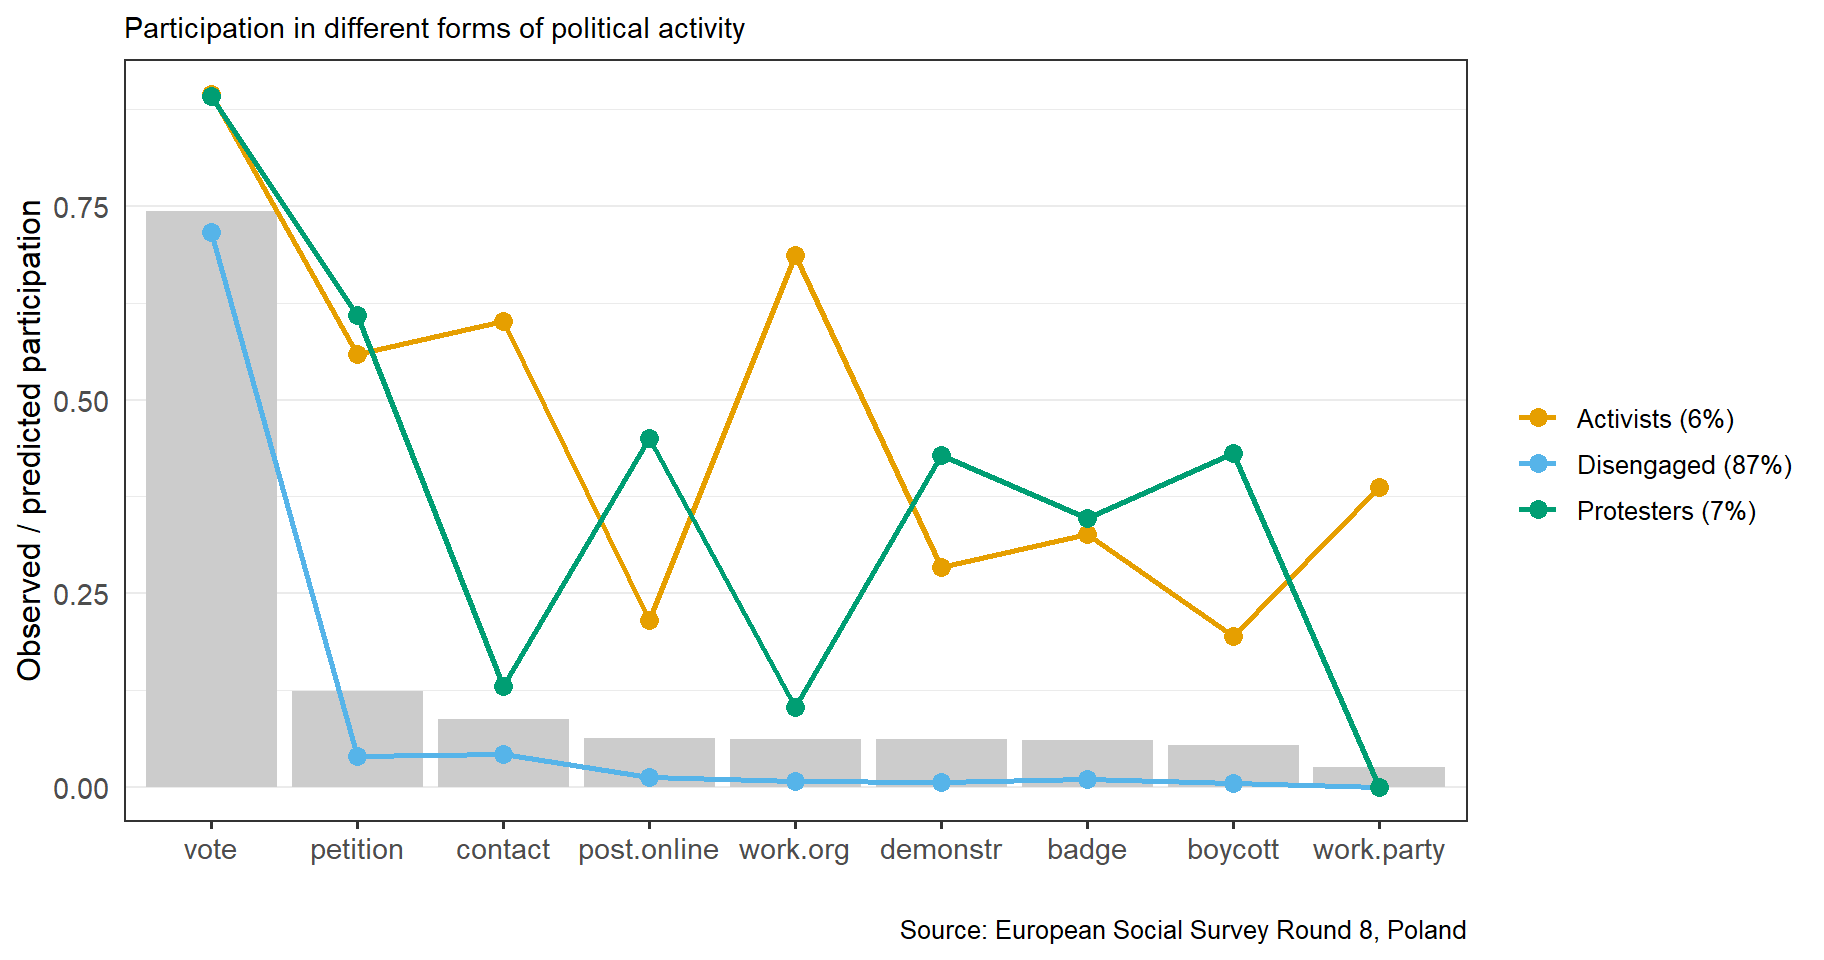
The graph below presents patterns of participation in different activities for each class. Activities are sorted in the order of descending participation in the entire sample. The bars indicate the prevelance of a given form of participation in the entire sample. The colored dots provide probabilities of participation in the given activity for members of the three latent classes, and the lines help connect the dots.
The largest group are the disengaged, who participate in general elections and do little more. According to the model, they account for about 87% of the population. The two engaged groups are around 6-7% each. The group I labelled “Activists” consists of individuals who, apart from voting, also choose institutional forms of participation, such as contacting politicians, and working for political parties and other organizations. The third group, “Protesters”, are primarily engaged in posting and sharing political content on-line, participating in demonstrations, wearing badges or stickers, and boycotting. The graph shows clearly that the two active groups - “Activists” and “Protesters” - tend to engage in different forms of participation, with the exception of signing petitions and wearing badges, which have similar probabilities in both groups.
The table below shows class means of standard predictors of political participation. According to this very basic analysis, “protesters” are on average younger, more female-dominated, more urban and less trusting of the parliament than the other groups. The “disengaged” tend to be older, less educated, and have lower income. Modeling the factors associated with class membership is material for a separate post.
| Class | N | Age | Female | Education | Income | Urban | Trust parliament |
|---|---|---|---|---|---|---|---|
| Activists | 103 | 44.932 | 0.456 | 14.594 | 6.325 | 0.262 | 3.460 |
| Disengaged | 1467 | 47.862 | 0.524 | 12.132 | 5.039 | 0.210 | 3.434 |
| Protesters | 124 | 40.831 | 0.565 | 15.066 | 6.566 | 0.556 | 2.927 |
| Note: | |||||||
|
Age in years; Education in schooling years; Income in deciles of household income; Urban = ‘A big city’ or ‘The suburbs or outskirts of a big city’; Trust in parliament 0-10 scale; Source: European Social Survey, Round 8, Poland. |
Region maps
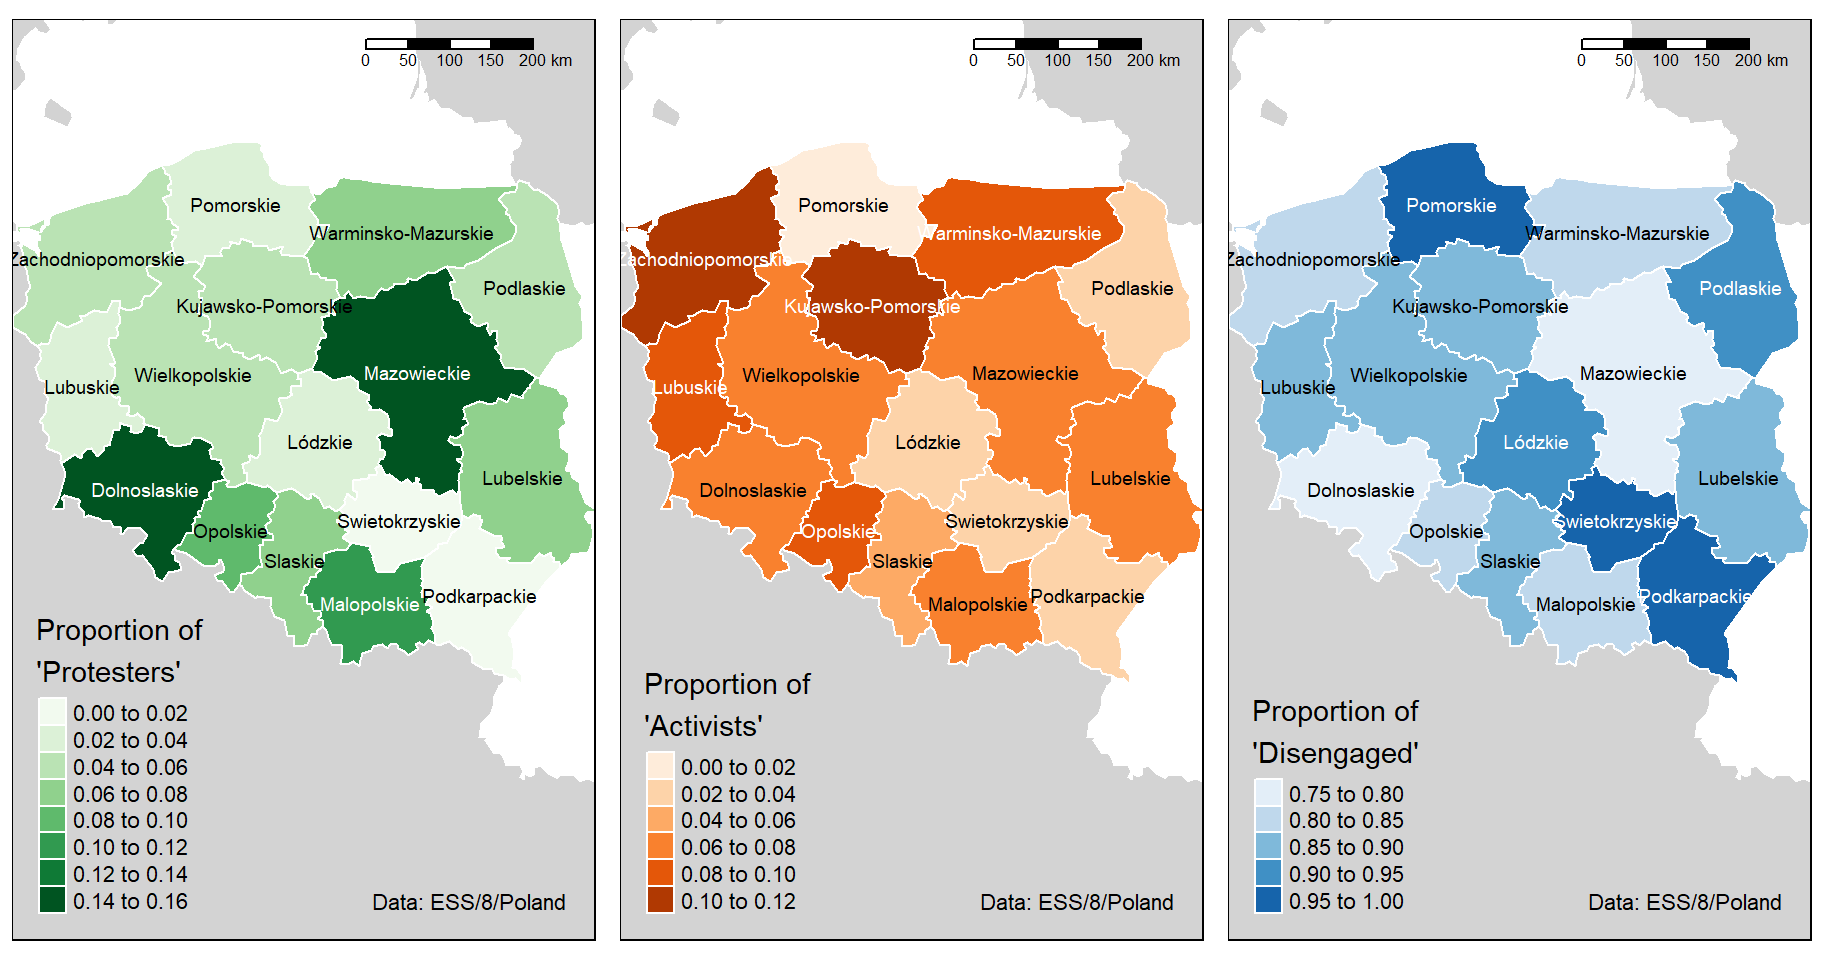
Ahead of Poland’s local government elections, I’m interested in looking at regional differences in participation. The ESS provides sub-national region identifiers in the NUTS classification (where available). In the Polish dataset regions are defined at the NUTS2 level, corresponding to 16 województwa.
With the eurostat package I download NUTS 2 shapes, combine them with aggregated ESS data, and plot with the tmap package.
The three maps below show the proportions of each class - “Activists”, the “Disengaged”, and “Protesters” - by region.
Voting in the last election, signing a petition; displaying a campaign badge or sticker; buycotting; donating money to a political organization or group; contacting politicians; boycotting products; visiting websites of political candidates or organizations; forwarding electronic messages with electronic content; working for a candidate’s campaign; working in a political party or action group, participating in political activities over the internet; taking part in a lawful public demonstration; working in a political organization (not campaign-related); participating in an illegal demonstration.↩
Voting in the last election; contacting a politician, government or local government official; working in a political party or action group; working in another organisation or association; wearing or displaying a campaign badge/sticker; signing a petition; taking part in a lawful public demonstration; boycotting certain products; posting or sharing anything about politics online, for example on blogs, via email or on social media such as Facebook or Twitter. Source: ESS Round 8. Source Questionnaire↩