Note: Results from this post are presented more systematically in the paper “Marketplace of indicators: Inconsistencies between country trends of measures of governance” co-authored with Paul Bürkner and available on SocArXiv: https://osf.io/preprints/socarxiv/u8gsc/.
Overview
Measuring corruption is hard, especially if one is interested in having corruption indicators that are comparable across countries and over time. Arguably the most famous corruption ranking is the Corruption Perceptions Index published annually by Transparency International, but it can’t be used for over-time comparisons (cf. Transparency International 2020, p. 26).
Other corruption indicators include:
Bayesian Corruption Indicator (BCI) published in the Quality of Government Dataset, QOG
Political Corruption Index by Varieties of Democracy, V-Dem
Control of Corruption (CC) in the World Bank’s Worldwide Governance Indicators, WGI
If these indicators measure the same concept, they should be correlated and change similarly over time, even if they are based on slightly different conceptualizations and definitions, rely on different source data, or use different calibration methods.
There exist reports that compare corruption indicators, but they describe the different methodologies and data sources, and at most calculate overall correlations, which are always very strong:
World Bank’s Policy Resesarch Paper Can We Measure the Power of the Grabbing Hand? A Comparative Analysis of Different Indicators of Corruption by Alexander Hamilton and Craig Hammer.
Our World in Data has a report on Corruption by Esteban Ortiz-Ospina and Max Roser.
Only Standaert (2015) notes the correlation between within-country changes in corruption as measured by the Bayesian Corruption Indicator he proposes, as well as the Corruption Perceptions Index and the Worldwide Governance Indicators. While overall correlations exceed 0.9, correlations between deviations from country averages range between 0.2 and 0.35, which means they are rather weak.
Let’s see how the three indicators compare.
Scatter plots
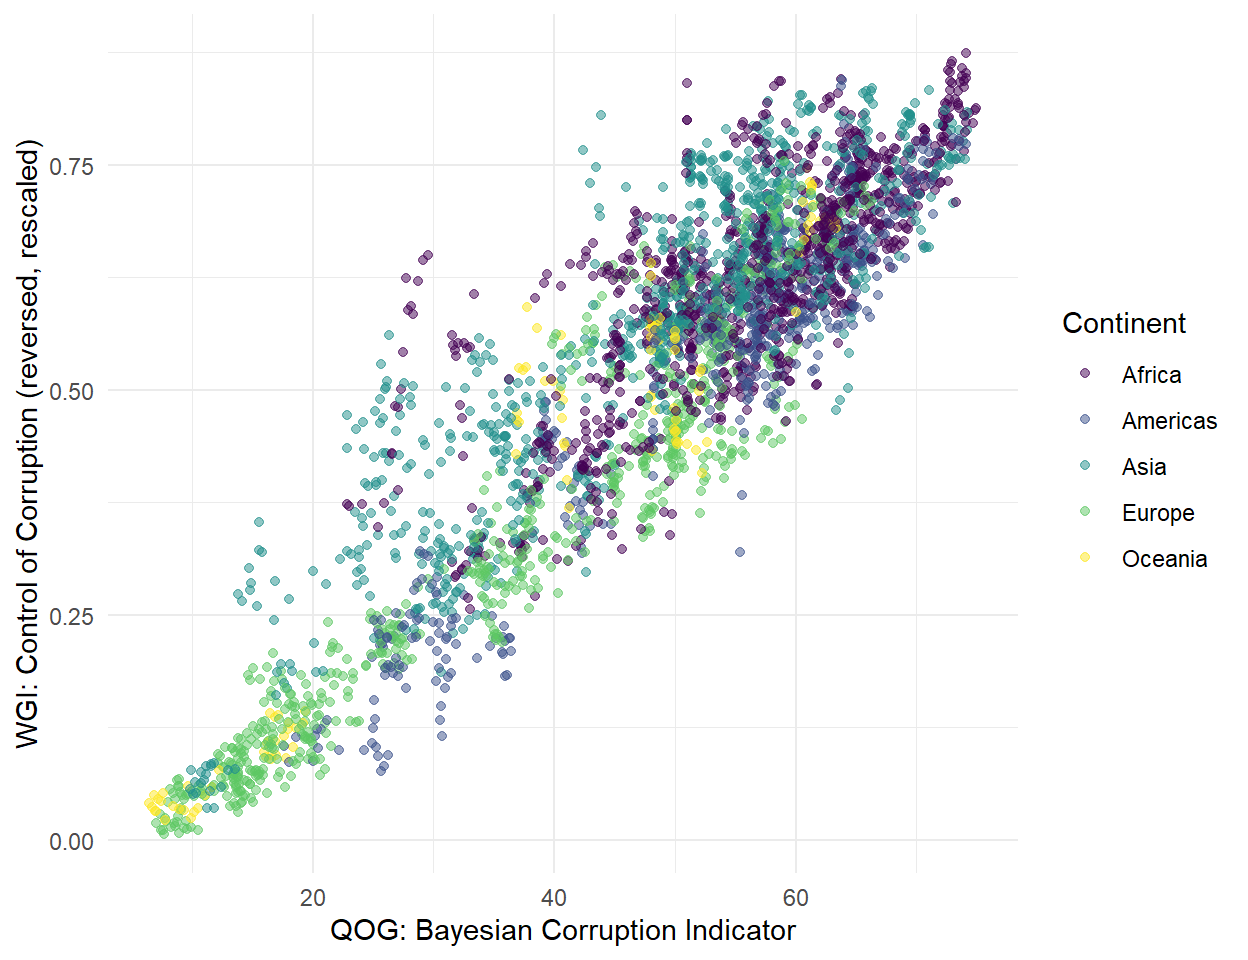
The correlation between the Bayesian Corruption Indicator (QOG) and Control of Corruption (WGI) is the strongest, because they rely on the same data but different estimation / scaling techniques (cf. Standaert 2015).
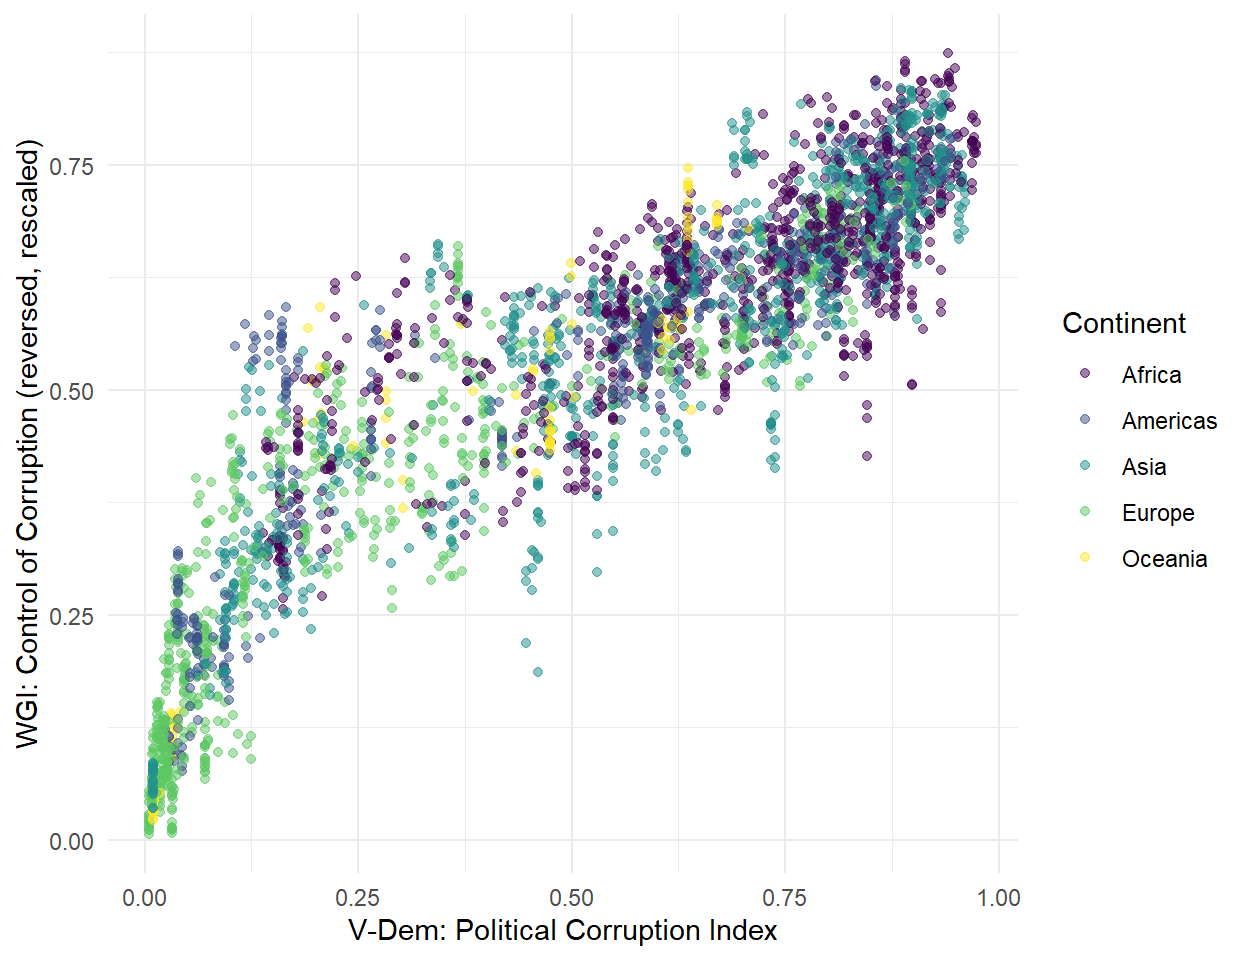
The association between the Political Corruption Index (V-Dem) and the Control of Corruption indicator (WGI) seems strong as well, but not necessarily linear and less consistent in the lower ranges of corruption.
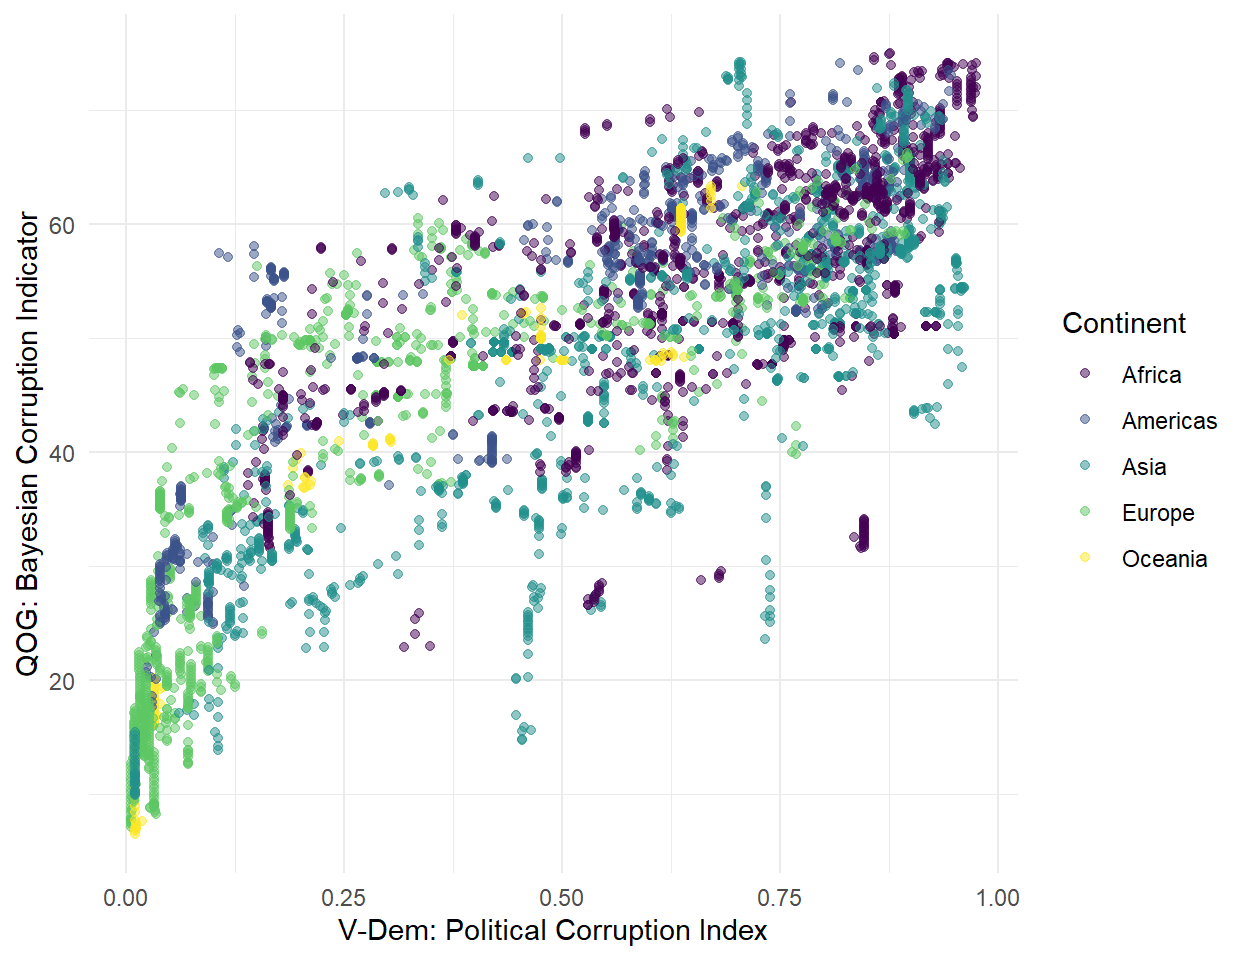
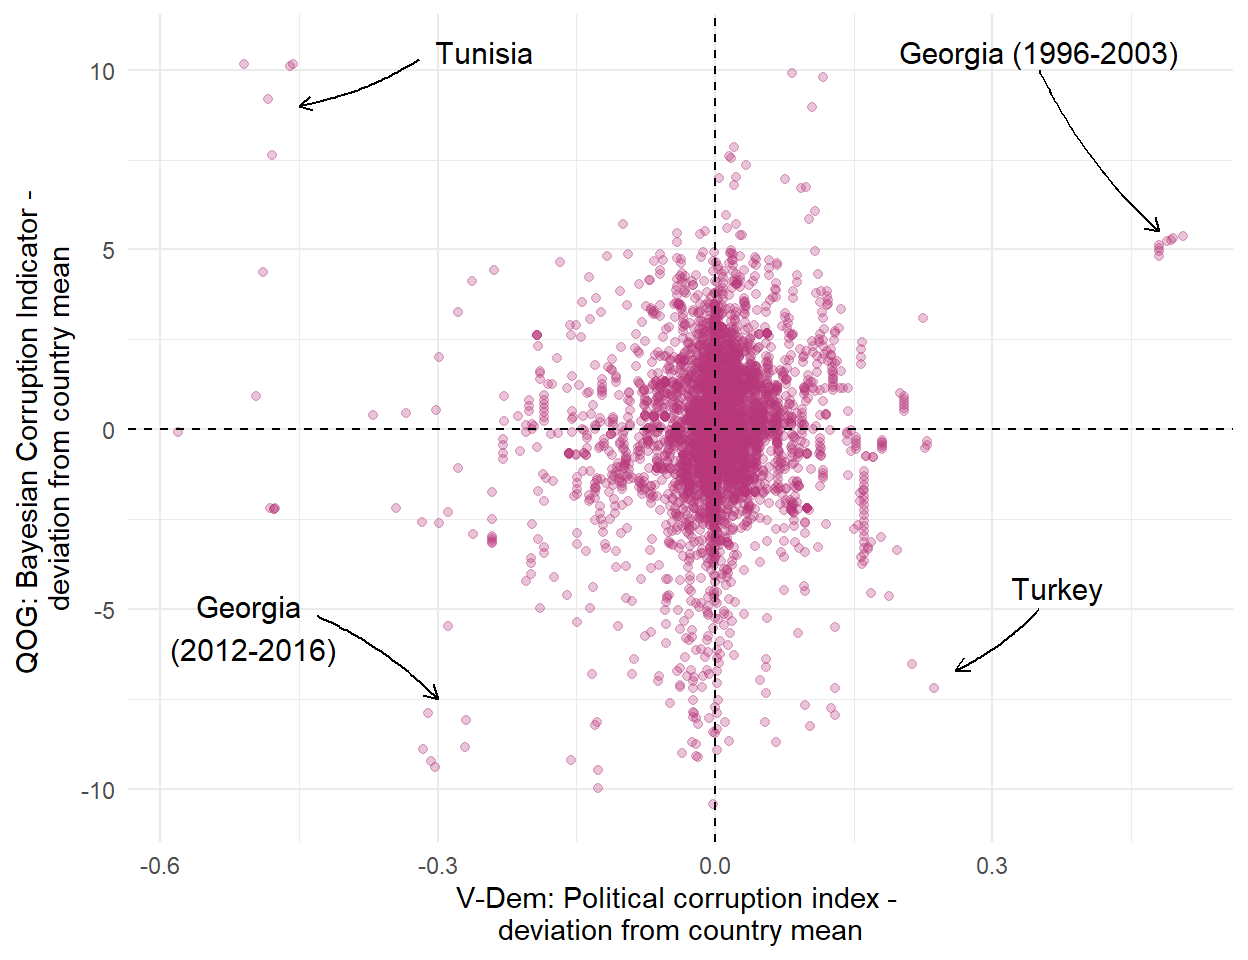
The association between the Political Corruption Index (V-Dem) and the Bayesian Corruption Indicator (QOG) is surprisingly weak. For medium levels of corruption according to BCI, i.e. around 0.5, the V-Dem indicator ranges between around 0.12 to almost 1, i.e. over almost its entire range.
Correlations
Let’s look at pairwise correlations to get the numbers.
First, correlations between levels of the three indicators for all country-years (some 4500 observations):
| qog_bci | wgi_cc | vdem_corr | |
|---|---|---|---|
| qog_bci | 1.000 | 0.91 | 0.816 |
| wgi_cc | 0.910 | 1.00 | 0.900 |
| vdem_corr | 0.816 | 0.90 | 1.000 |
Next, pairwise correlations between country means for 173 countries:
| qog_bci_mean | wgi_cc_mean | vdem_corr_mean | |
|---|---|---|---|
| qog_bci_mean | 1.000 | 0.925 | 0.833 |
| wgi_cc_mean | 0.925 | 1.000 | 0.921 |
| vdem_corr_mean | 0.833 | 0.921 | 1.000 |
Now, pairwise correlations between within-country deviations from the means:
| qog_bci_diff | wgi_cc_diff | vdem_corr_diff | |
|---|---|---|---|
| qog_bci_diff | 1.000 | 0.341 | 0.088 |
| wgi_cc_diff | 0.341 | 1.000 | 0.303 |
| vdem_corr_diff | 0.088 | 0.303 | 1.000 |
These last correlarions are very weak. As shown in the scatterplot, there is little consistency between the de-meaned V-Dem Political Corruption Index and the Bayesian Corruption Indicator.
Looking at continents separately, correlations between the Bayesian Corruption Indicator and the V-Dem Corruption Index are negligible in Africa, the Americas, and Europe, and small in Asia and Oceania. In Europe, the correlation is actually negative.
## `summarise()` ungrouping output (override with `.groups` argument)| Continent | N country-years | N countries | QOG - V-Dem | WOG - WGI | V-Dem - WGI |
|---|---|---|---|---|---|
| Africa | 1370 | 54 | 0.037 | 0.300 | 0.293 |
| Americas | 750 | 27 | 0.034 | 0.232 | 0.220 |
| Asia | 1220 | 47 | 0.214 | 0.372 | 0.433 |
| Europe | 991 | 39 | -0.023 | 0.480 | 0.135 |
| Oceania | 150 | 6 | 0.234 | -0.053 | -0.053 |
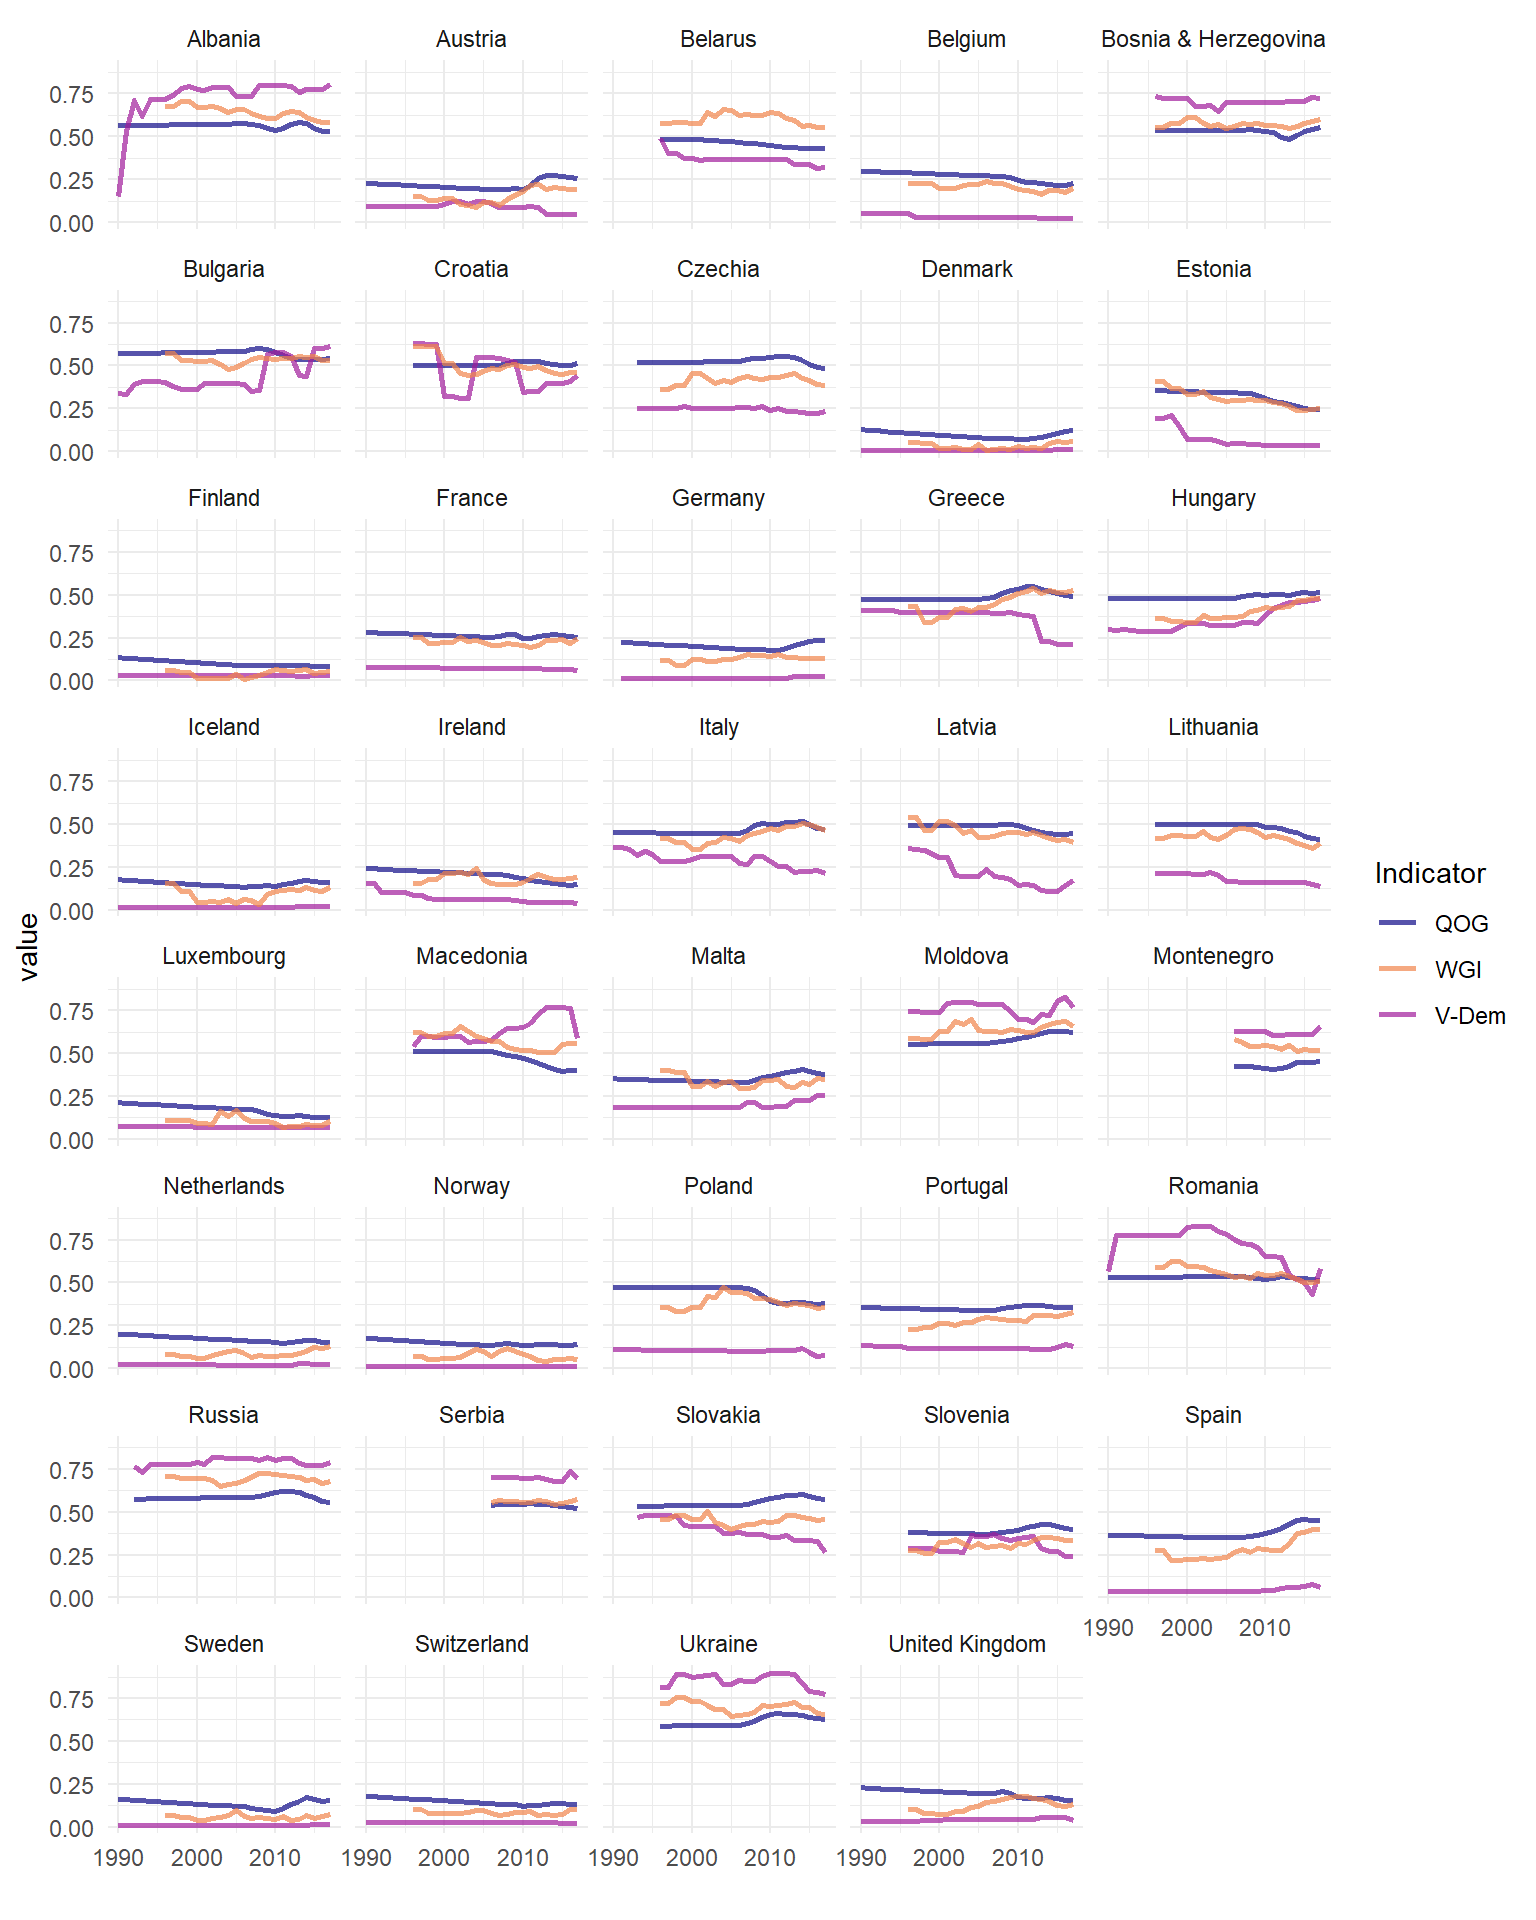
Trends in corruption indicators in Europe, 1990-2019
How does this weak correlation look like when looking at corruption trajectories? As shown below, the V-Dem index has little to do with the remaining two indicators. The V-Dem index is much more volatile, but only in countries where it changes at all. In most Western European countries the V-Dem index barely moves, while the QOG and WGI indicator constantly change, even if only a little.
There are also situations where the indicators move in opposite directions. In Macedonia, for example, in the late 2000s, the V-Dem index improved, while the other two dropped. In the recent years in Italy, the V-Dem index declined and the other two increased.
All in all, it looks like the choice of the corruption indicator can have huge consequences for results of longitudinal analyses (but probably not of cross-national models) which is of course disturbing.