
Where did the current governing party get their votes from? Did supporters of the previous ruling party switch preferences or did they abstain from voting altogether? Cross-sectional datasets, such as one-off election polls, do not typically provide data to answer these questions. Panel studies, such as the Polish Panel Survey (POLPAN), do.
The graphs below show voting trajectories of POLPAN respondents in the last three parliamentary elections in Poland: in 2007, 2011, and 2015. Data come from three most recent waves of POLPAN carried out in 2008, 2013, and 2018. Respondents with any missing values have been excluded, which means that the sample only includes respondents who participated all three most recent waves of POLPAN, and are aged 31 or above. Mean age equals 55 (range from 31 to 95), and 51% of the samples are women. The sample used to plot the below graphs comprises 686 respondents. To improve readability, the graphs only present flows with more than two respondents.
The graphs were created with the ‘alluvial’ package1. The code used in this post is available here.
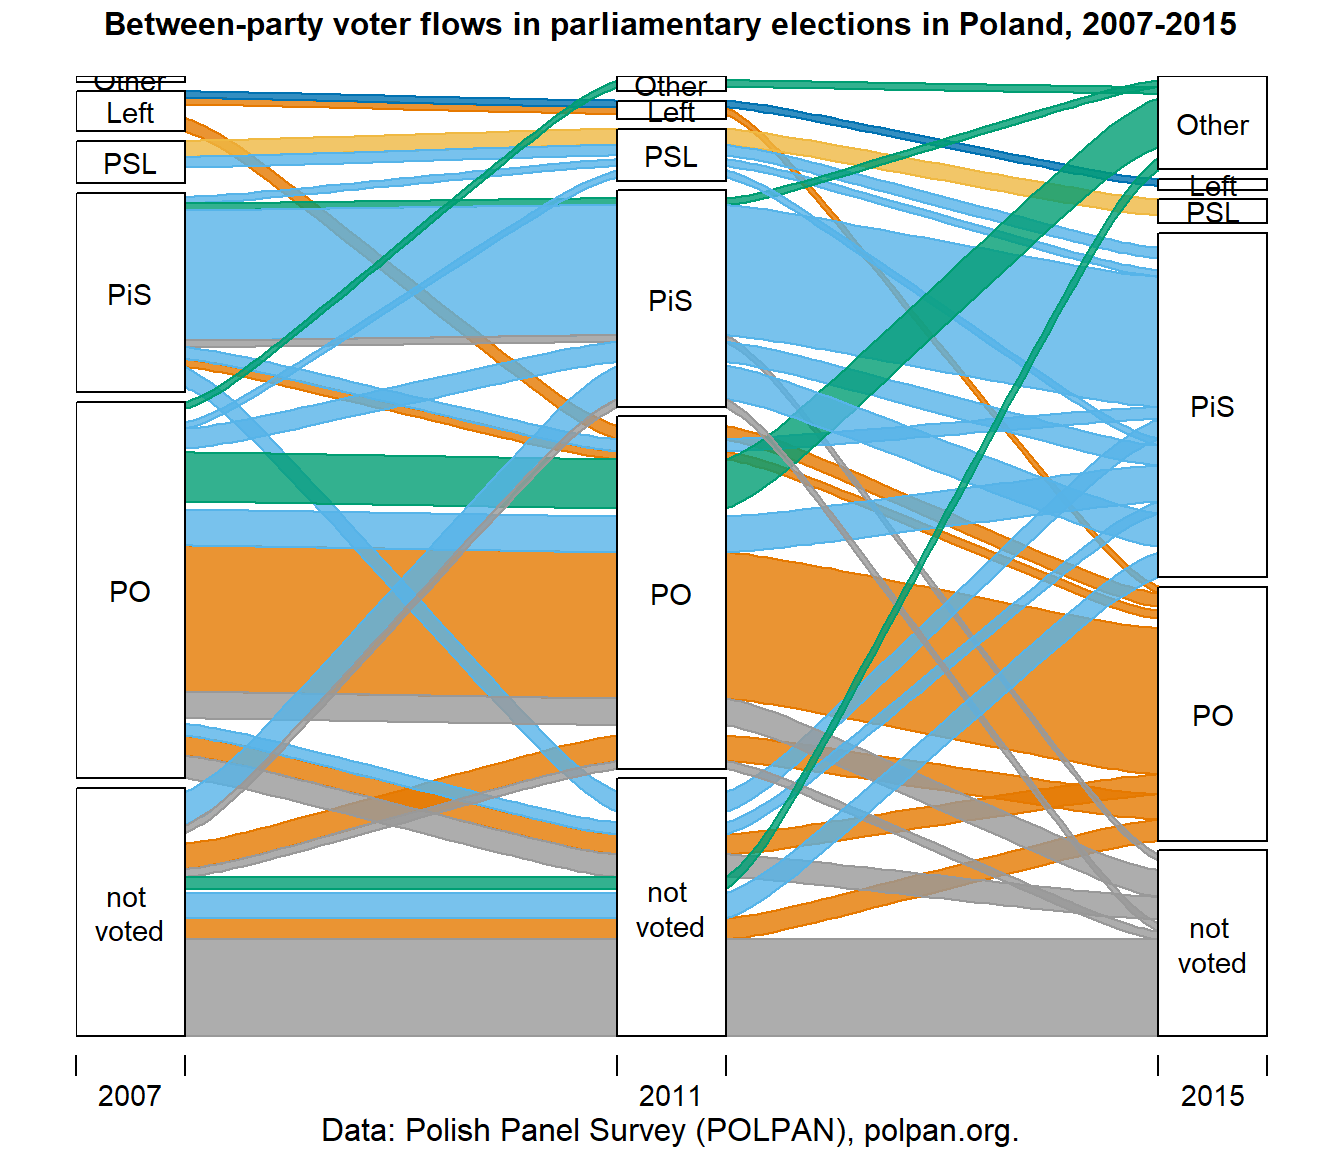
How 2015 voters voted in 2007 and 2011
In the first graph flows are colored from the point of view of the most recent elections, showing past preferences of voters for particular parties in 2015. It shows, for example, that the current ruling party - PiS (Prawo i Sprawiedliwość = Law and Justice), which substantially improved their voter share between 2011 and 2015, won quite some votes from the previous majority party - PO (Platforma Obywatelska = Civic Platform), as well as mobilized a number of former non-voters. At the same time, PO lost support to the advantage of PiS and other parties, but attracted some voters who had previously opted for the left-wing parties.
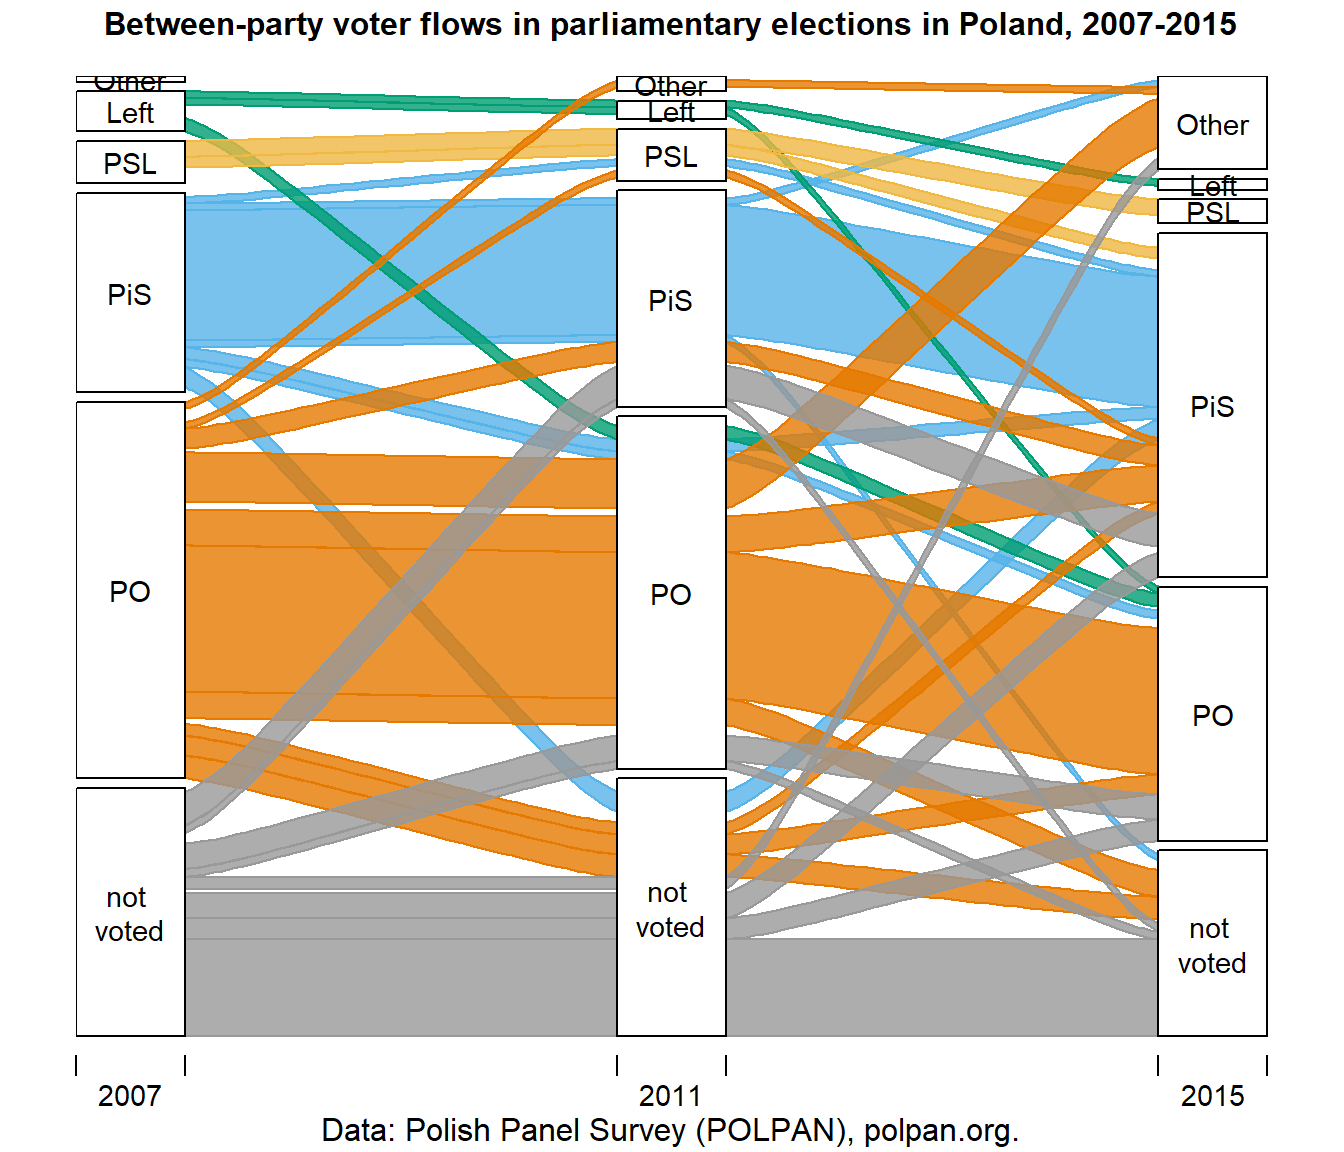
How 2007 voters voted in 2011 and 2015
The second graph presents the same flows from the point of view of the 2007 election. It shows, among others, how some supporters of the majority party in 2007, PO, in subsequent elections either switched to PiS or decided not to vote at all. Of the individuals who voted for left-wing parties (primarily the Democratic Left Alliance, SLD) in 2007, over half eventually switched to PO, either in 2011 or in 2015. As of 2015 SLD has no representation in the Polish parliament.
About POLPAN
The Polish Panel Survey (POLPAN) is a panel study carried out in Poland since 1988 in 5-year intervals. The current edition is funded by the Polish National Science Centre. It is focused on describing the social structure and its change, and includes detailed items of respondents’ employment situation and history, education history, as well as meritocratic attitudes, attitudes toward stat institutions, political participation, household composition, and others. Fieldwork for the 2018 round has been completed, and the data will be made publicly available soon. The data from earlier waves of POLPAN are available through the Polish Social Data Archive and the GESIS - Leibniz Institute for the Social Sciences. The current wave of data collection is funded by the Polish National Science Centre’s grant “Multidimensional Biographies and Social Structure: Poland 1988-2018” (UMO-2017/25/B/HS6/02697).
There are a few ways to create such graphs in R. I like ‘alluvial’ package, but alternatives include ‘ggparallel’ and ‘ggalluvial’.↩