Cross-national survey projects conduct surveys on representative samples of adult populations. How do the distributions of respondents’ age vary across surveys carried out in the same country in different years and different projects?
Like in a couple of previous posts (here, here and here) I use data from the Survey Data Recycling dataset (SDR) version 1, which includes selected harmonized variables from 22 cross-national survey projects. SDR only includes surveys that claim to have samples representative for adult populations. The code for manipulating the data and plotting can be found here on GitHub.
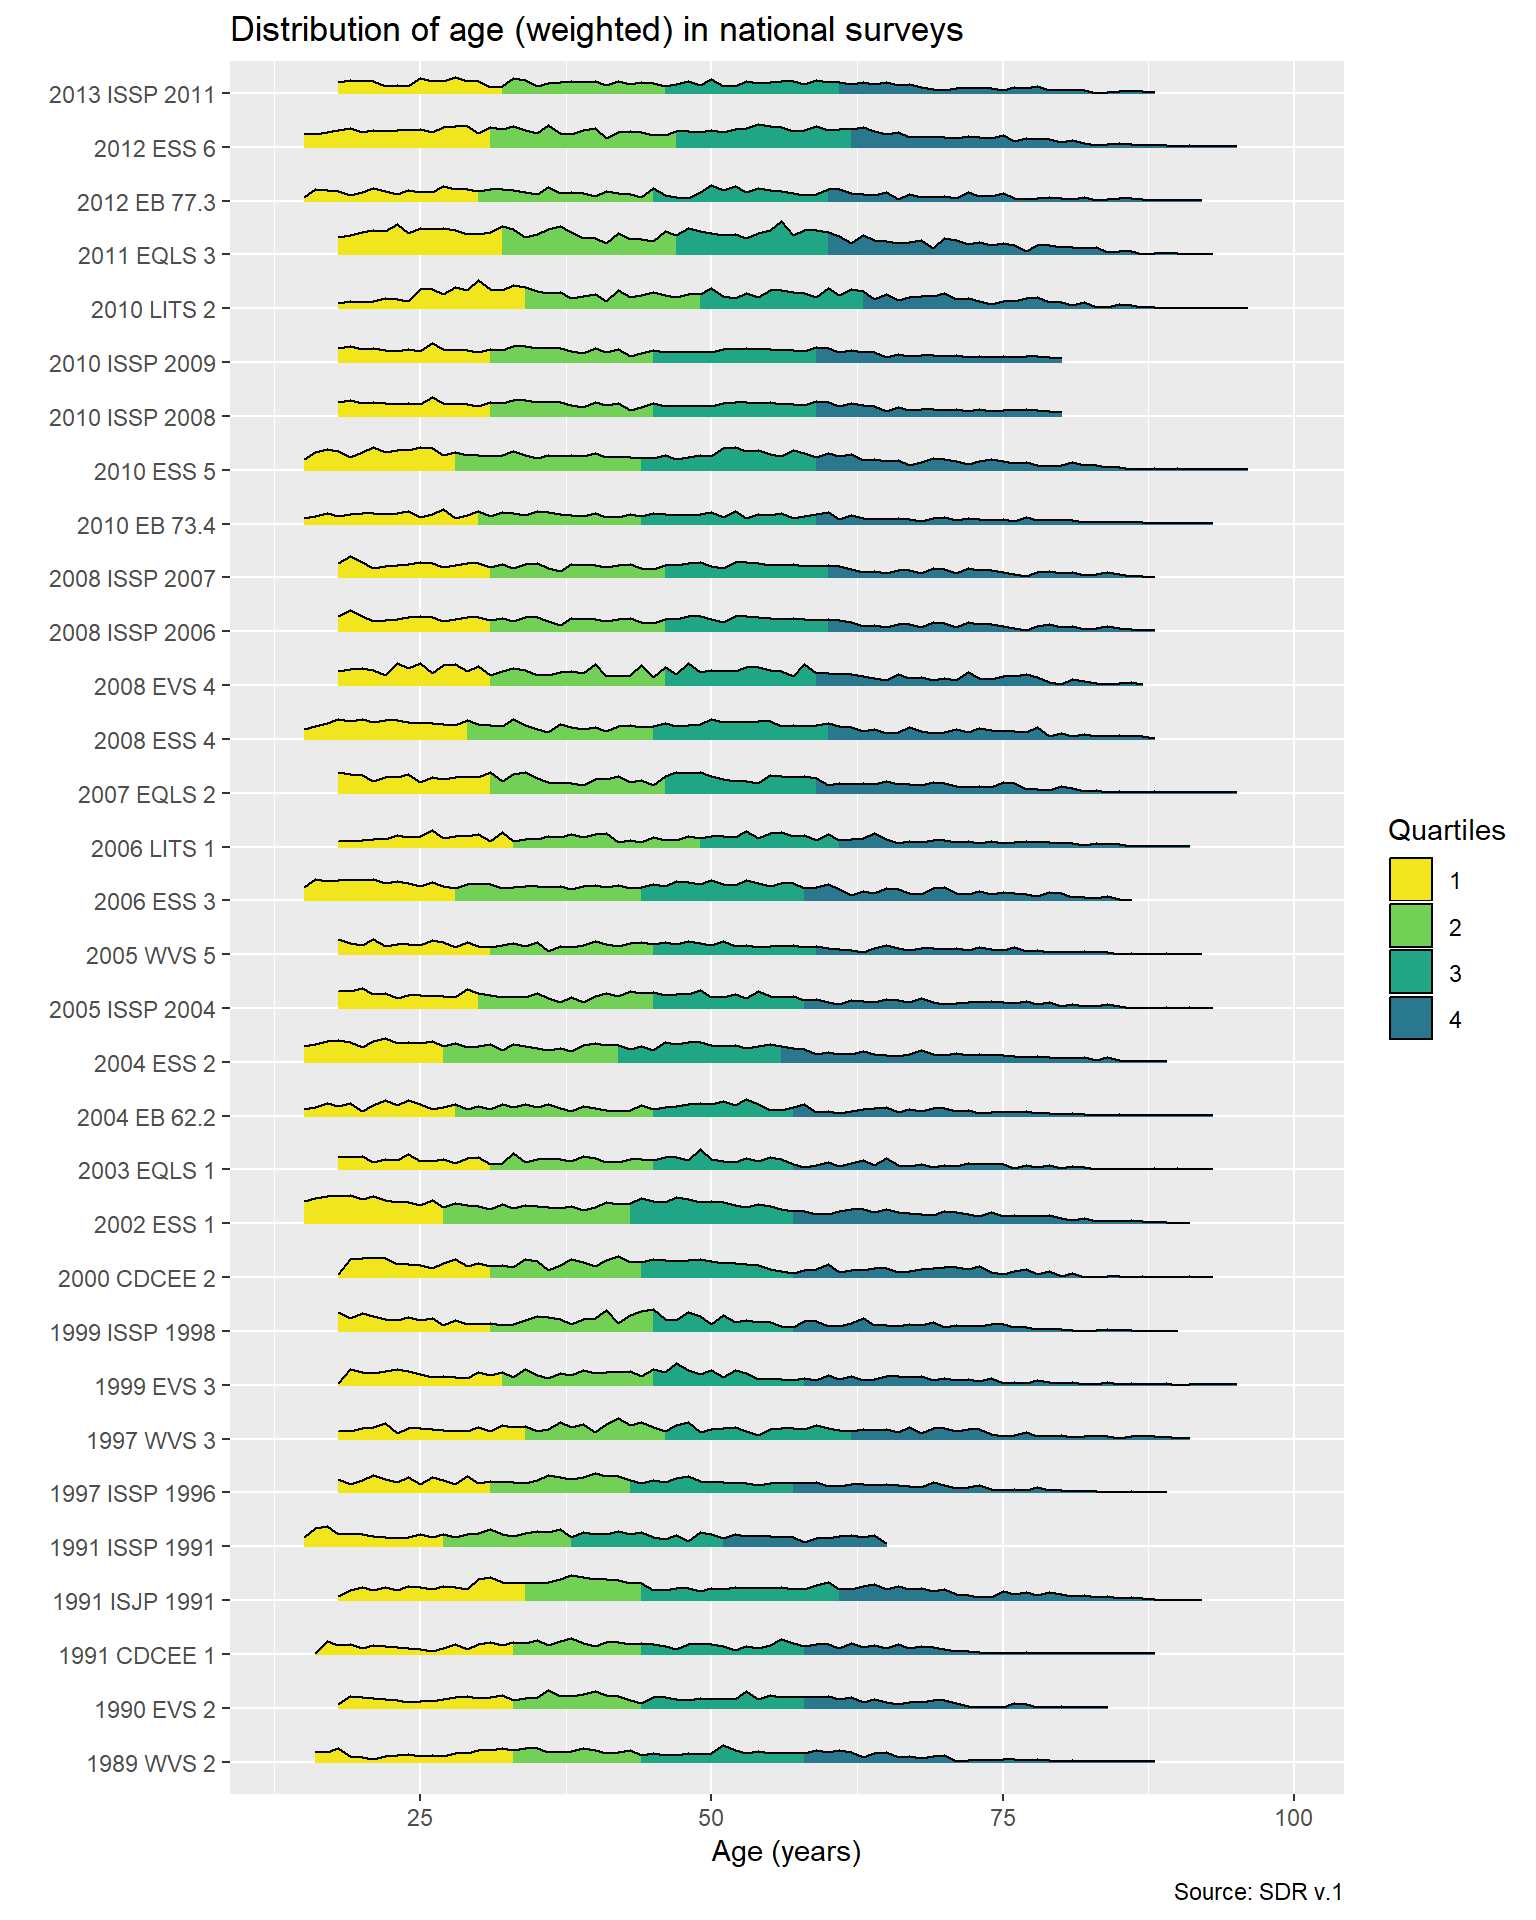
The ridgeline plot (thanks to the ggridges package) presents the distributions of age in all 32 samples from Poland from the SDR v.1 dataset, arranged from the oldest surveys at the bottom to the most recent surveys at the top. Colors identify age quartiles, and differences in the hight of graphs between surveys reflect differences in the sample sizes. Distributions are weighted with the case weights provided with the original data. In the SDR dataset values higher than 96 were recoded to missing, because many surveys has surprisingly high numbers of respondents aged 97-99 (likely because these are common missing value codes).
Age distributions for all surveys included in the SDR v.1 dataset can be plotted with this Shiny app: https://mkolczynska.shinyapps.io/sdr_age_distributions/.
How does this variation influence the comparability of sample estimates between samples? And how to adjust samples when calculating and comparing, e.g., rates of participation in politics?