The growth in cross-national survey projects in the last decades leads to situations when two or more surveys are carried out in the same country and the same year but in different projects, and contain overlapping sets of survey questions. Assuming that the surveys are based on representative samples - a claim that major cross-national survey projects typically make - it could be expected that estimates from surveys carried out in the same country and year are reasonably close.
In this post I analyze survey multiplets with regard to the popualar survey question about participation in a public demonstrations in the last year (or 12 months). I use data from the Survey Data Recycling dataset (SDR) version 1, which includes selected harmonized variables from 22 cross-national survey projects. SDR only includes surveys that (1) contain items on political attitudes or political participation, and that (2) are intended as representative for entire adult populations. For other selection criteria see here; for information about how to download the SDR dataset from Dataverse to R see this post).
The code for manipulating the data and for plotting is pretty long, so I don’t show it here to keep the post concise; the full code can be found here on GitHub.
Data
The SDR database contains data from 1721 national surveys (surveys carried out in a given country and year and in a given project). Of those, 1148 national surveys have some question about participation in demonstrations, 335 surveys have the question about participation in a demonstration in the last 12 months / one year.
There are 29 country-years that have more than one survey with the “demonstrations” variable of interest (“last year”). This includes 28 survey pairs and one survey triplet (Spain 2004), for a total of 59 national surveys from five project listed below.
| Abbreviation | Project name |
|---|---|
| AFB | Afrobarometer |
| CNEP | Comparative National Elections Project |
| EB | Eurobarometer |
| EQLS | European Quality of Life Survey |
| ESS | European Social Survey |
Differences within country-years
I start with comparing proportions of positive answers to the “participation in demonstations” for entire (weighted) samples.
As the graph below shows, some differences are very small, the median difference is around 1.8 percentage points, but a few are very large. For example, reported participation rates for Czechia (2004, ESS and EB) and Denmark (2011, ESS and EB) are almost identical.
At the same time, in Mozambique (2005, CNEP and AFB) and in Spain (2004, ESS and EB) the differences are over 20 percentage points and 15 percentage points, respectively.

Differences by groups
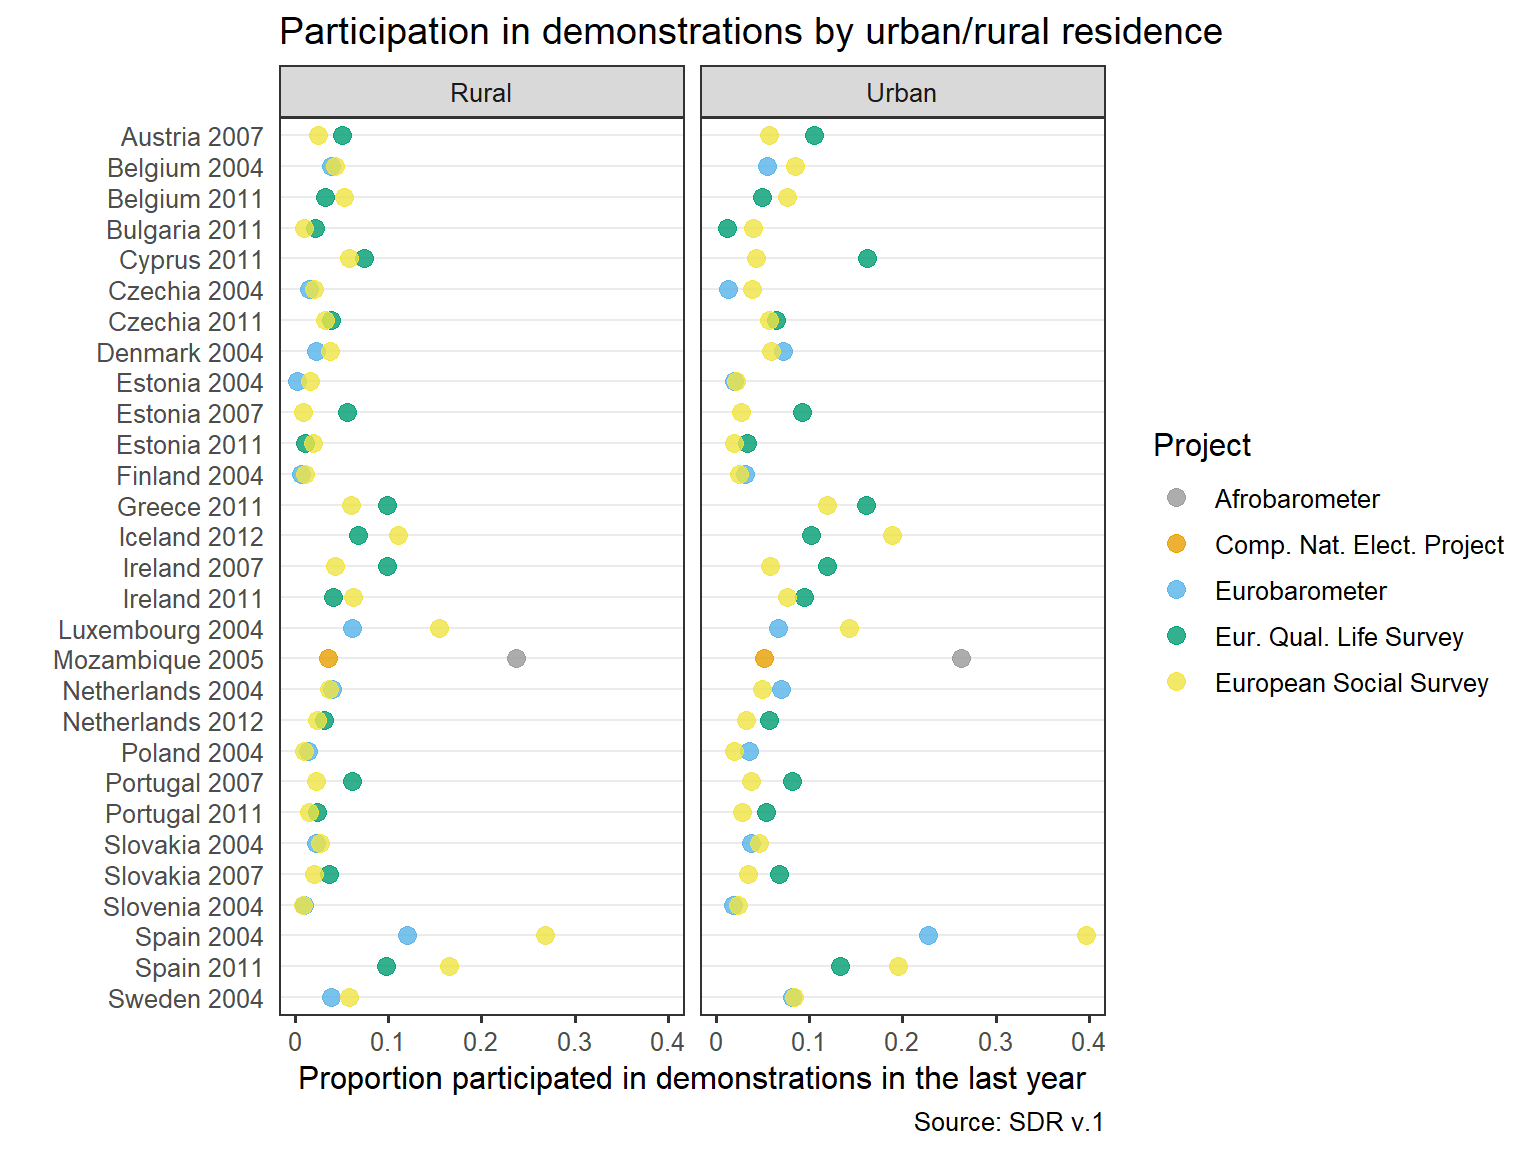
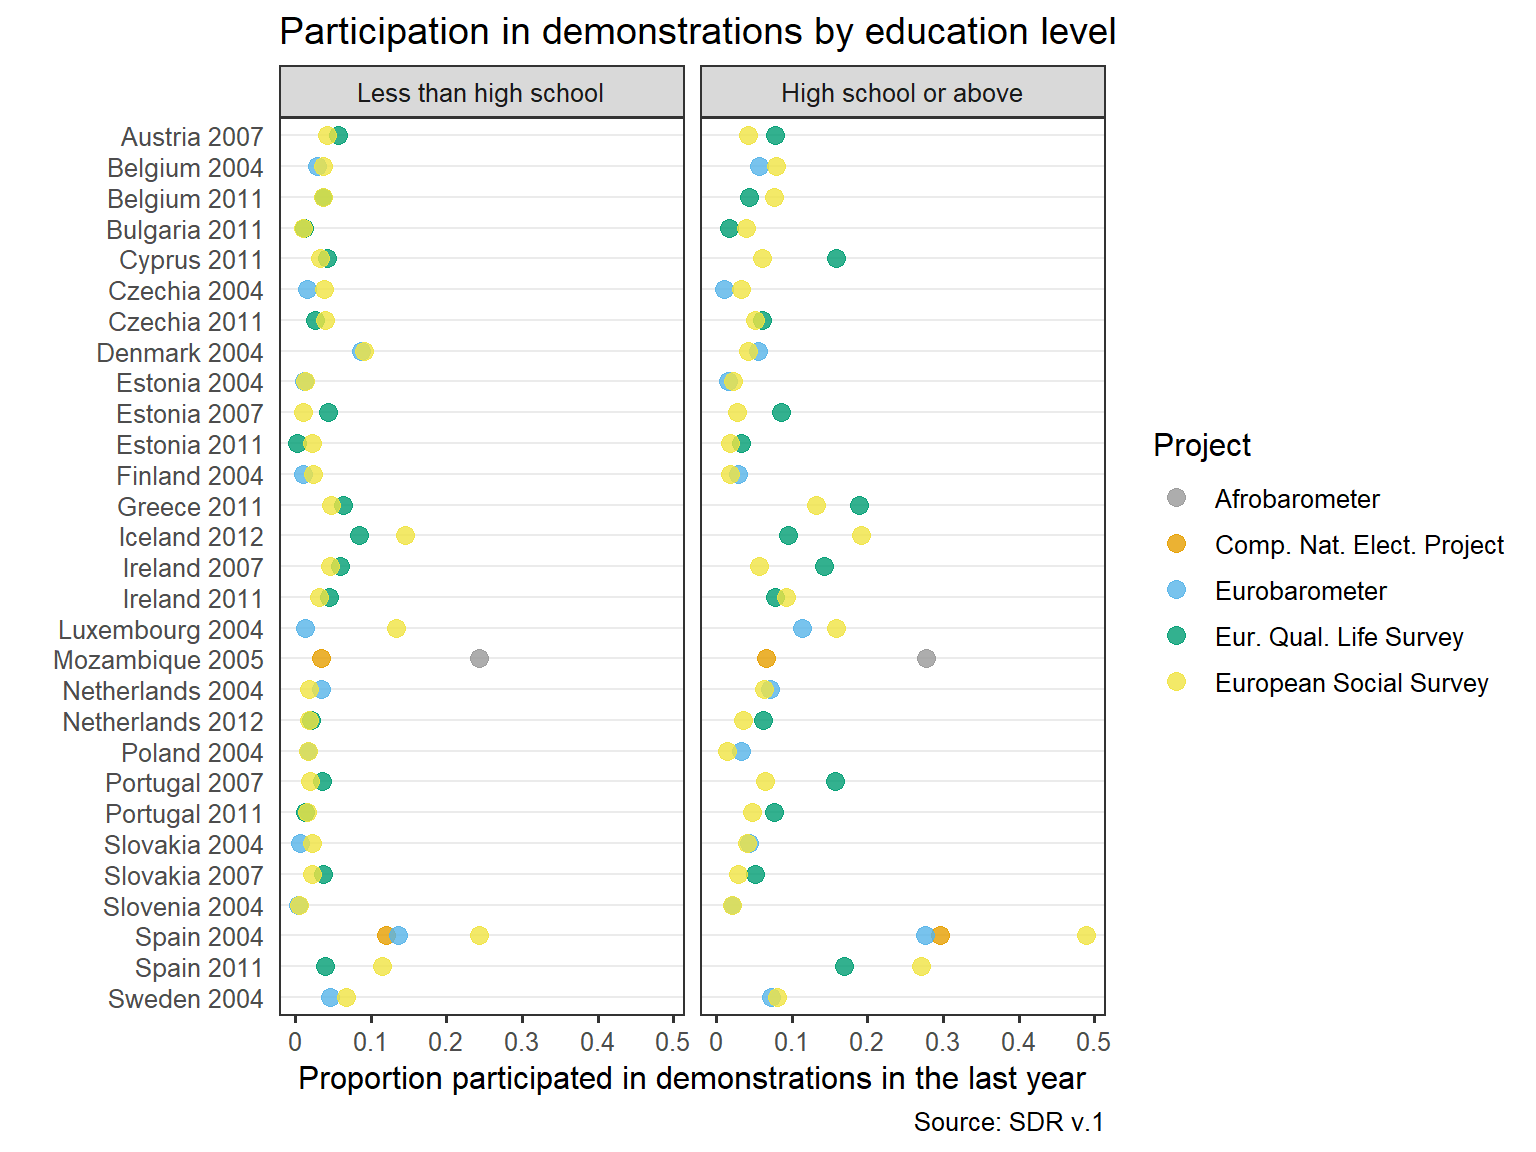
Splitting the sample into groups to compare the differences in the estimates might shed some light on the sources of these largest deviations and help identify most problematic categories of respondents. Below are charts comparing sample proportions by Respondents’ gender, age, rural/urban residence, and education. These additional variables come from the SDR database, i.e. are the product of ex post harmonization.
The last plot includes information about the sampling scheme used in these surveys. Sampling schemes have been coded, on the basis of survey documentation, into six categories: single-stage sample, multistage based on individual register, multistage based on address register, samples with a random route component, samples with a quota component, “insufficient information”, and “no information”.
Gender

Age

Urban/rural residence

Education

Sampling scheme
Various reasons for large differences are possible. Surveys might differ in the exact wording of the question about participation in demonstrations or in other elements of questionnaire design in subtle ways that respondents nevertheless perceive and react to. Differences in sampling design or non-response bias might also result in different proportions of more active individuals across samples. In this case estimates from the unbiased (or less biased) sample would be closer to the population parameter. If surveys are carried out at different times of the year, and there is a protest wave in-between, the later survey will rightly show a higher proportion of demonstration participants - in this case both measurements would be accurate. More research is needed.
