
with Przemek Powałko
Individual economic status is a necessary element of almost all sociological analyses, including studies of political attitudes and behavior. To supplement the already harmonized variables in the Survey Data Recycling dataset (SDR) version 1 and for the purposes of my resesarch of the effects of education on political engagement, Przemek and I harmonized two additional variables: personal income and household income1.
In this post we briefly describe the harmonization procedures and explore the properties of the harmonized income variables. The full documentation as well as the data will be made available shortly. The code used in this post is available here.
Data
Surveys measure economic status in various ways. Some issues to consider when harmonizing such variables from different survey projects include:
1. household or personal,
2. income or earnings,
3. net or gross,
4. weekly, monthly, or annual,
5. recorded as exact amounts in some currency, quantiles, or categories other than quantiles.
Since many surveys ask both about personal and household income, we decided to harmonize them separately. Within these two types of measures (of household and personal income) surveys typically have just one question with some combination of properties from points 2-5 above. It would be very hard to convert all income questions to a common metric, e.g. constant USD in purchasing power parity. Instead, we treated the income variables as rankings, trying to preserve relative distances between scores where possible. Income variables harmonized in this way can be used as control variables (e.g., to obtain the effect of education net of economic status), to compare groups within the sample (e.g., men and women), but cannot be used for comparisons of sample aggregates, e.g., means across surveys.
Of the 22 international survey projects in the SDR v.1 dataset, source variables measuring household income are available in 18 projects, and individual income in 10 projects. Surveys in 9 projects have both variables.
| Abbr. | Project | N surveys with household income | N surveys with personal income | N surveys with both |
|---|---|---|---|---|
| ABS | Asian Barometer | 30 | 0 | 0 |
| AFB | Afrobarometer | 15 | 0 | 0 |
| AMB | Americas Barometer | 90 | 0 | 0 |
| ARB | Arab Barometer | 16 | 16 | 16 |
| ASES | Asia Europe Survey | 18 | 0 | 0 |
| CB | Caucasus Barometer | 12 | 12 | 12 |
| CDCEE | Consolidation of Democracy in Central Eastern Europe | 0 | 27 | 0 |
| CNEP | Comparative National Elections Project | 3 | 3 | 1 |
| EB | Eurobarometer | 53 | 0 | 0 |
| EQLS | European Quality of Life Survey | 93 | 0 | 0 |
| ESS | European Social Survey | 134 | 0 | 0 |
| EVS | European Values Study | 128 | 0 | 0 |
| ISJP | International Social Justice Project | 20 | 20 | 20 |
| ISSP | International Social Survey Programme | 356 | 355 | 350 |
| NBB | New Baltics Barometer | 18 | 9 | 9 |
| PA2 | Political Action II | 3 | 3 | 3 |
| PA8NS | Political Action - An 8 Nation Study | 8 | 6 | 6 |
| PPE7N | Political Participation and Equality in 7 Nations | 4 | 2 | 2 |
| WVS | World Values Survey | 176 | 0 | 0 |
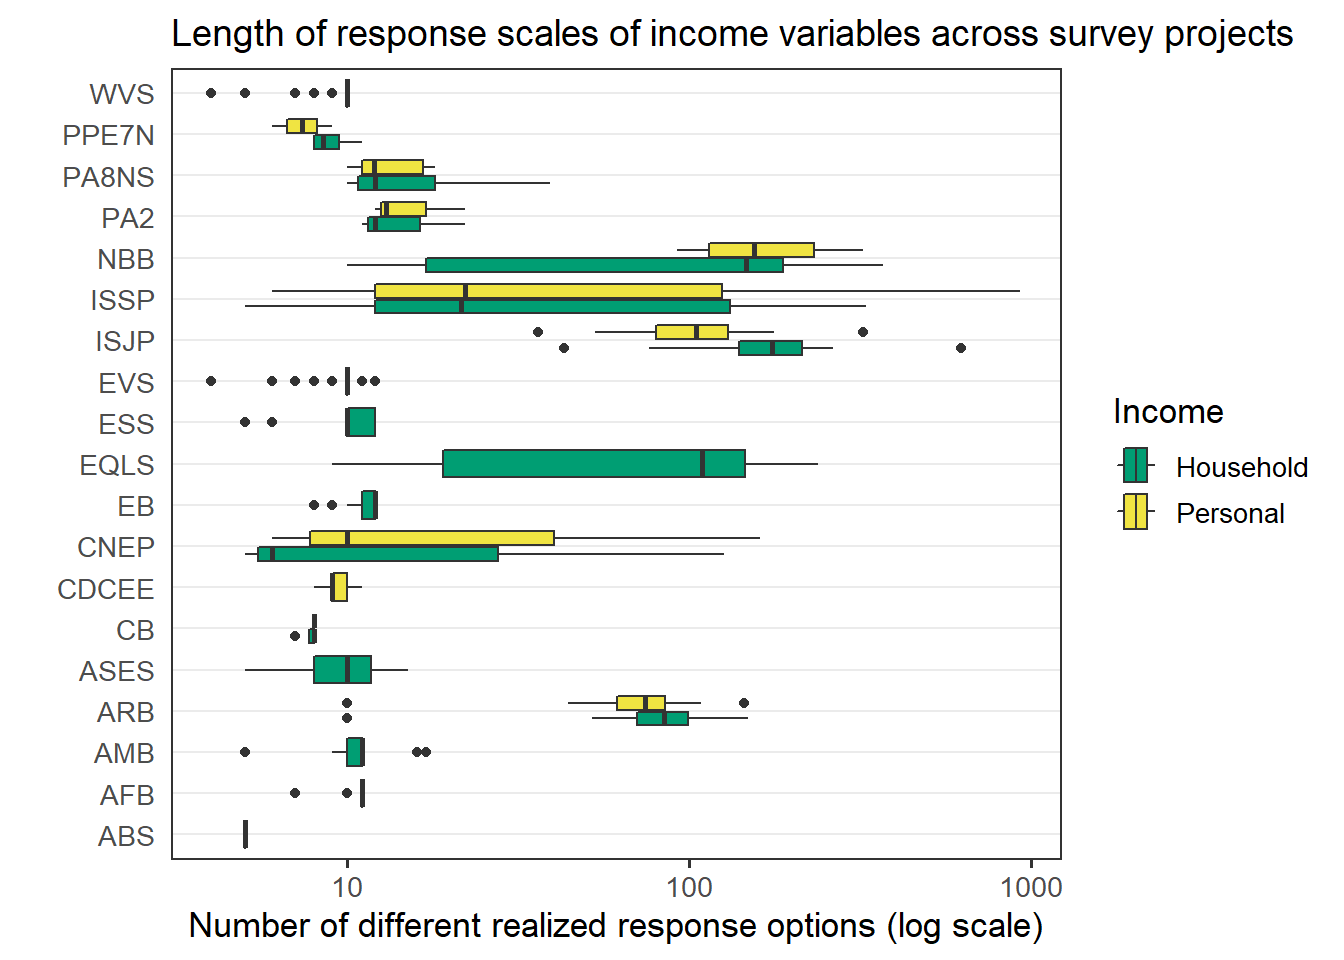
Number of response options
As already mentioned, surveys ask about the exact value of one’s income, or ask that the respondent select a category containing their income, with categories sometimes constructed to represent quantiles in the country’s income distribution. As a result, surveys differ with regard to the number of distinct values realized in each sample, which ranges from 4 to 622 in the case of household income, and from 6 to 928 for personal income. The graph below shows how the length of response scales varies within and between survey projects (with the x axis in log scale).
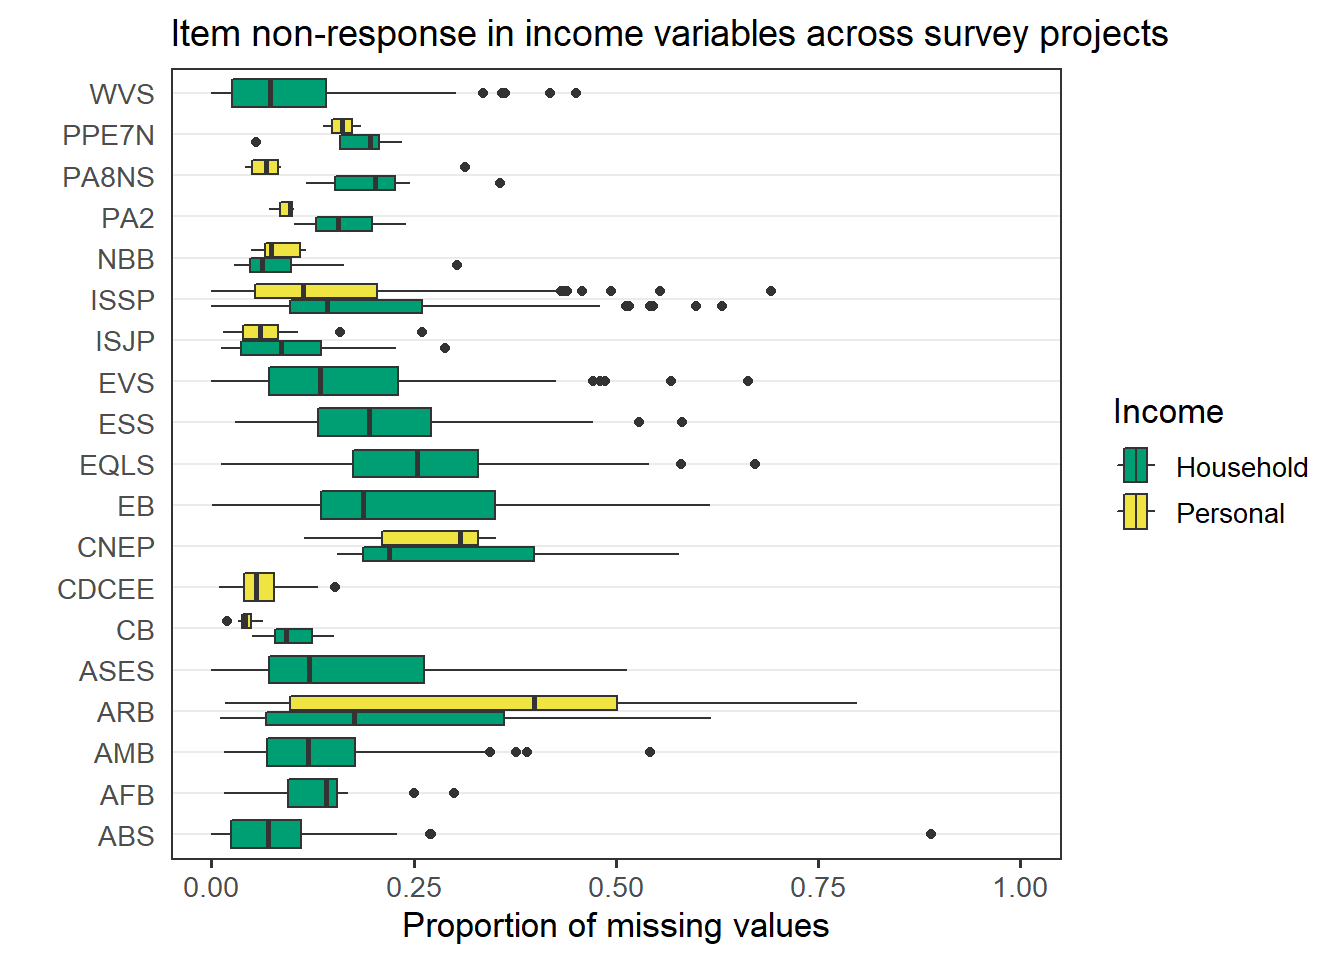
Item non-response
Income is one of the sensitive questions where item non-response tends to be high. The graph below shows the distribution of missing values to the two income questions by survey project. Item non-response in personal income ranges from 0 to 80% (ARB/2/Algeria). In the case of household income the highest non-response is 89% (ABS/2/China).
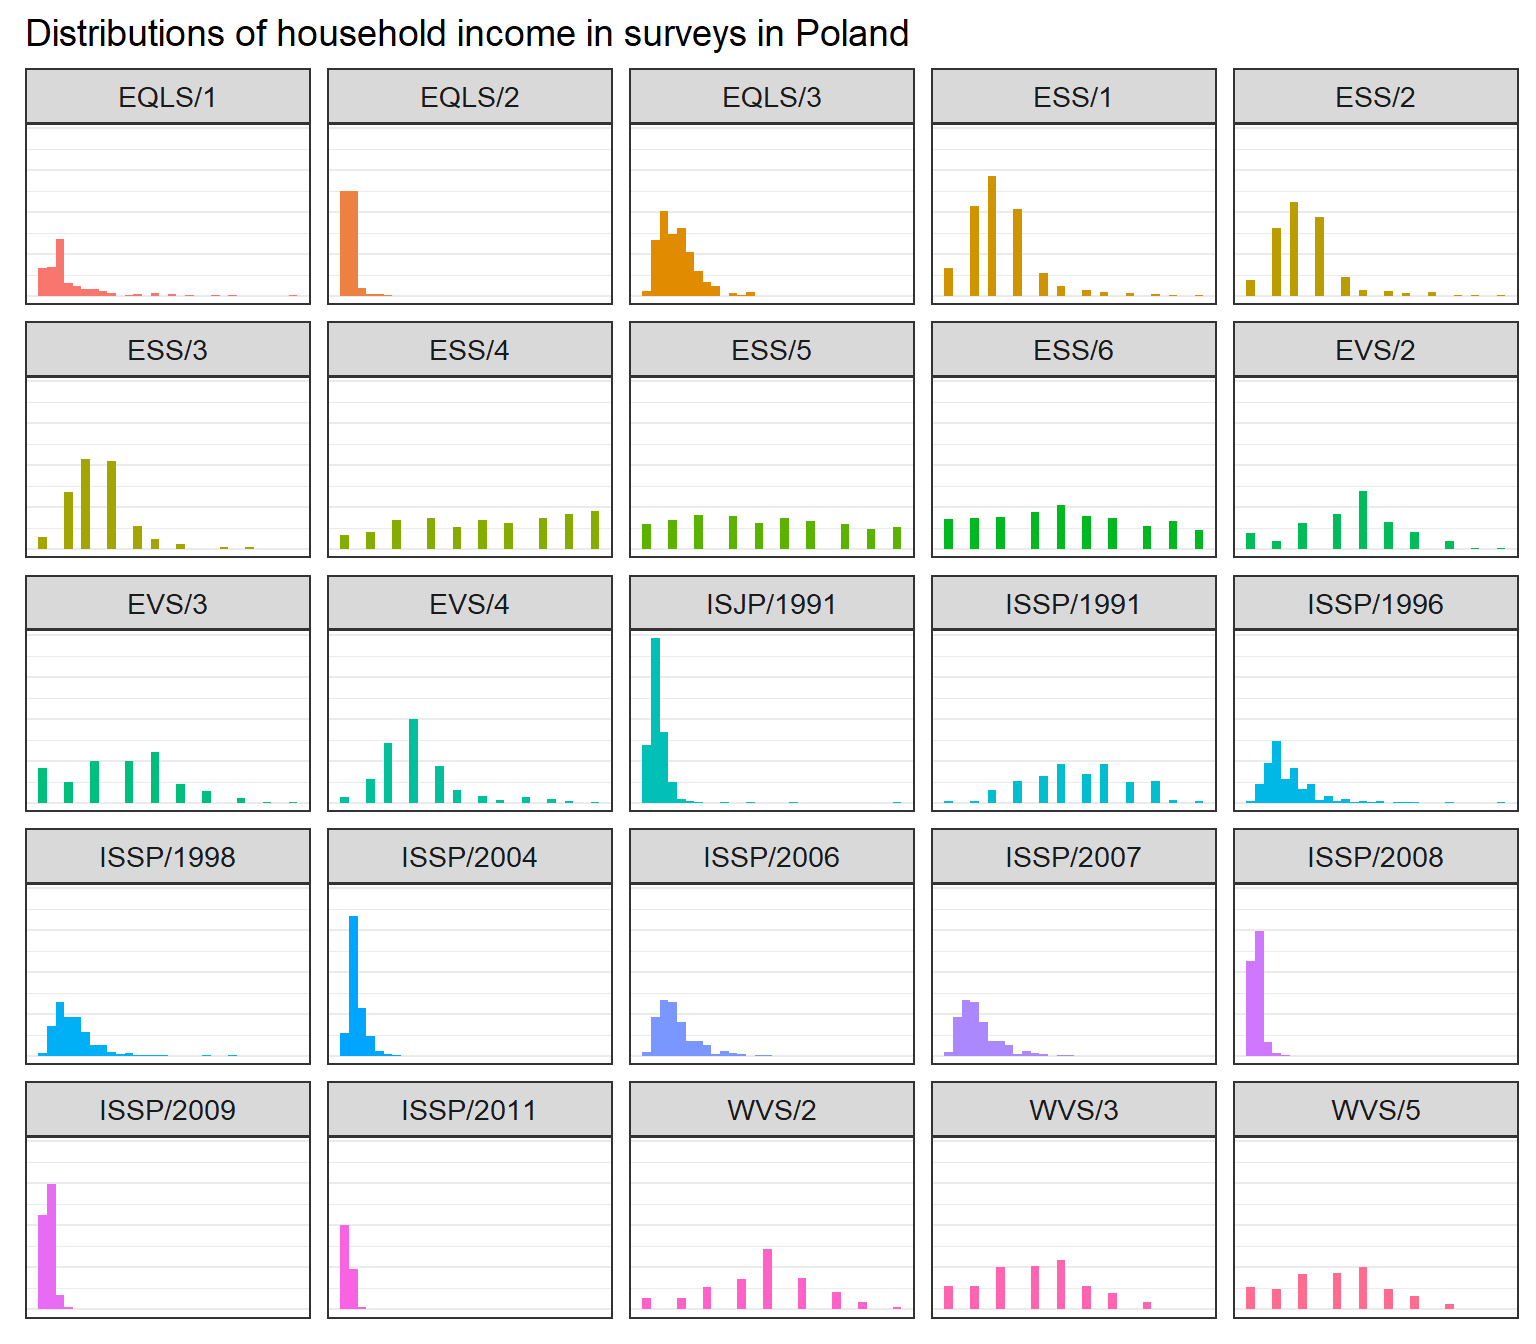
Distributions
As already mentioned, different surveys record income in exact amounts (in the local currency or US dollars), in quantiles, or other categories. This has consequences for the distributions of income, which have different shapes in different surveys. Below is an illustration of the variation in the distribution of original (not transformed) variables on the example of household income in 25 samples from Poland.
Of the presented surveys, EQLS first recoded income in 19 categories, and moved to exact values in rounds 2 and 3. ESS started with 10 categories (not corresponding to quantiles) and switched to deciles starting with round 4, which is when the distribution becomes almost uniform. EVS uses 10-12 categories. ISJP asks about exact amounts. ISSP started with 12 categories in 1991 and in later waves recorded exact amounts. Finally, WVS records household income in 9-10 categories.
Harmonized target variables
We created four harmonized target variables for household and personal income each. The first one is a cleaned version of the source variables with the original codes for substantive answers and unified missing value codes for non-responses, and - where applicable - reversed so that higher values correspond to more income (t_income_hh and t_income_personal). The second variant (t_income_hh_rank_100 and t_income_personal_rank_100) represents the rank position of the respondent, rescaled into the range between 0 (lowest income) to 100 (highest income). The third variant rescales income to the scale 0-100 maintaining the relative distances between values (t_income_hh_prop_100 and t_income_personal_prop_100). The fourth variant corresponds to the relative position in the cumulative distribution within the given national sample (t_income_hh_distrib and t_income_personal_distrib).
Below is an illustration of the recoding of source values (s_income_hh) to target values on the example of household income in AFB/2/Mozambique.
| s_income_hh | t_income_hh | t_income_hh_rank_100 | t_income_hh_prop_100 | rel.distr | cum.distr | t_income_hh_distrib |
|---|---|---|---|---|---|---|
| 0 | 0 | 0.00 | 0 | 0.506 | 0.506 | 25 |
| 3 | 3 | 16.67 | 30 | 0.247 | 0.753 | 63 |
| 4 | 4 | 33.33 | 40 | 0.121 | 0.874 | 81 |
| 6 | 6 | 50.00 | 60 | 0.073 | 0.946 | 91 |
| 8 | 8 | 66.67 | 80 | 0.031 | 0.978 | 96 |
| 9 | 9 | 83.33 | 90 | 0.014 | 0.991 | 98 |
| 10 | 10 | 100.00 | 100 | 0.009 | 1.000 | 100 |
Next steps
Harmonized economic position variables open new possibilities for substantive and methodological research, e.g. on the effects of under- and over-rewarding on political participation and attitudes. Before this happens, a lot of time needs to be spent exploring the harmonized variables to identify errors or suspicious cases that should be either corrected or exaplained, or excluded.
This work was suppoted by the annual Silverman Research Support Award from the Department of Sociology, The Ohio State University (2017) and an internal research grant funded by the Institute of Philosophy and Sociology, Polish Academy of Science Effects of status inconsistency on political values, attitudes and behavior: a cross-national analysis with survey data harmonized ex post.↩